Load–velocity and load–power curves combined
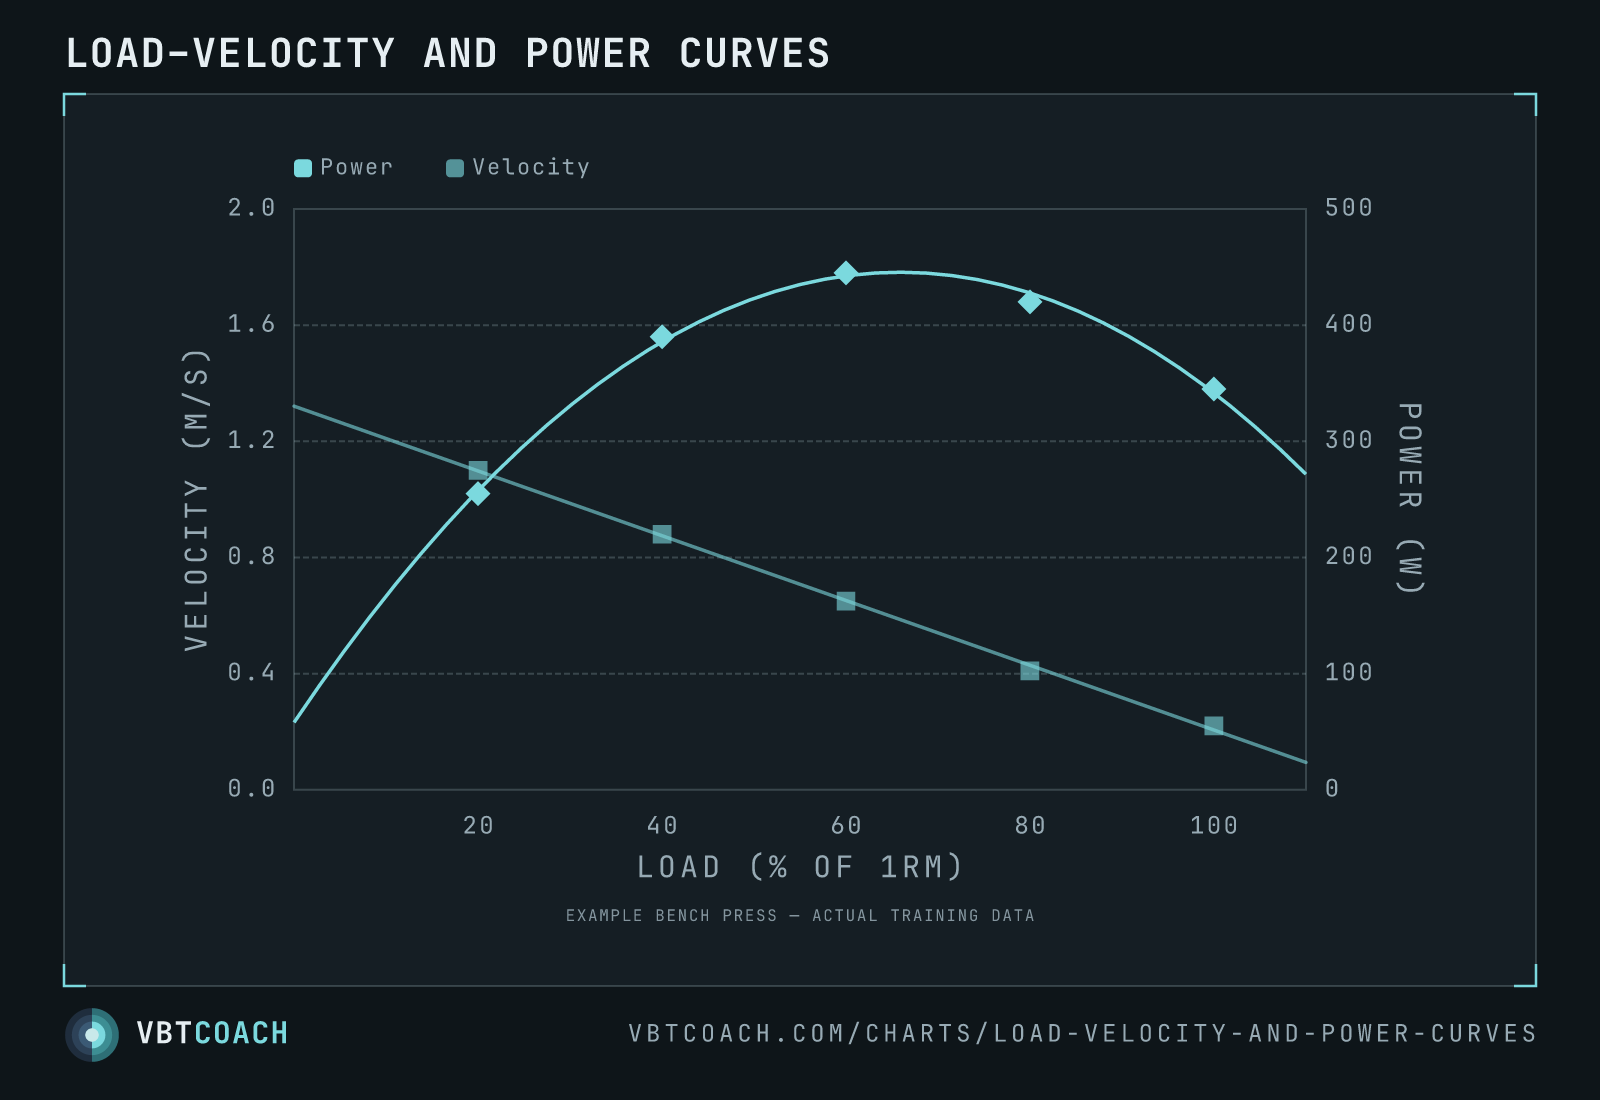
Linear LV profile (descending) and parabolic power curve (peaking mid-load) overlaid on the same load axis, dual y-axes. Shows why peak power lives between heavy strength loads and light speed loads.
The same set of working reps yields two curves. Velocity (left axis) falls linearly with load — the load–velocity profile. Power (right axis) rises with load until it doesn’t — the load–power curve, peaking near 40–60 % 1RM. Plotting both on the same load axis shows why the peak-power load sits where it does: it’s the intersection where force and velocity multiply to the largest product.
The visual makes a programming case in one frame. Training only at the strength end (heavy, slow) shifts the strength axis but misses the power peak. Training only at the speed end (light, fast) shifts the velocity axis but builds little force. Mixed blocks that touch loads on both sides of the power peak develop the whole curve.
Download high res chart images
High-resolution PNG, 1600×1000, watermarked. Free to share, embed in slides, or print. Credit appreciated.