Fry 2004 — Strength athletes are type-II dominant; bodybuilders aren't
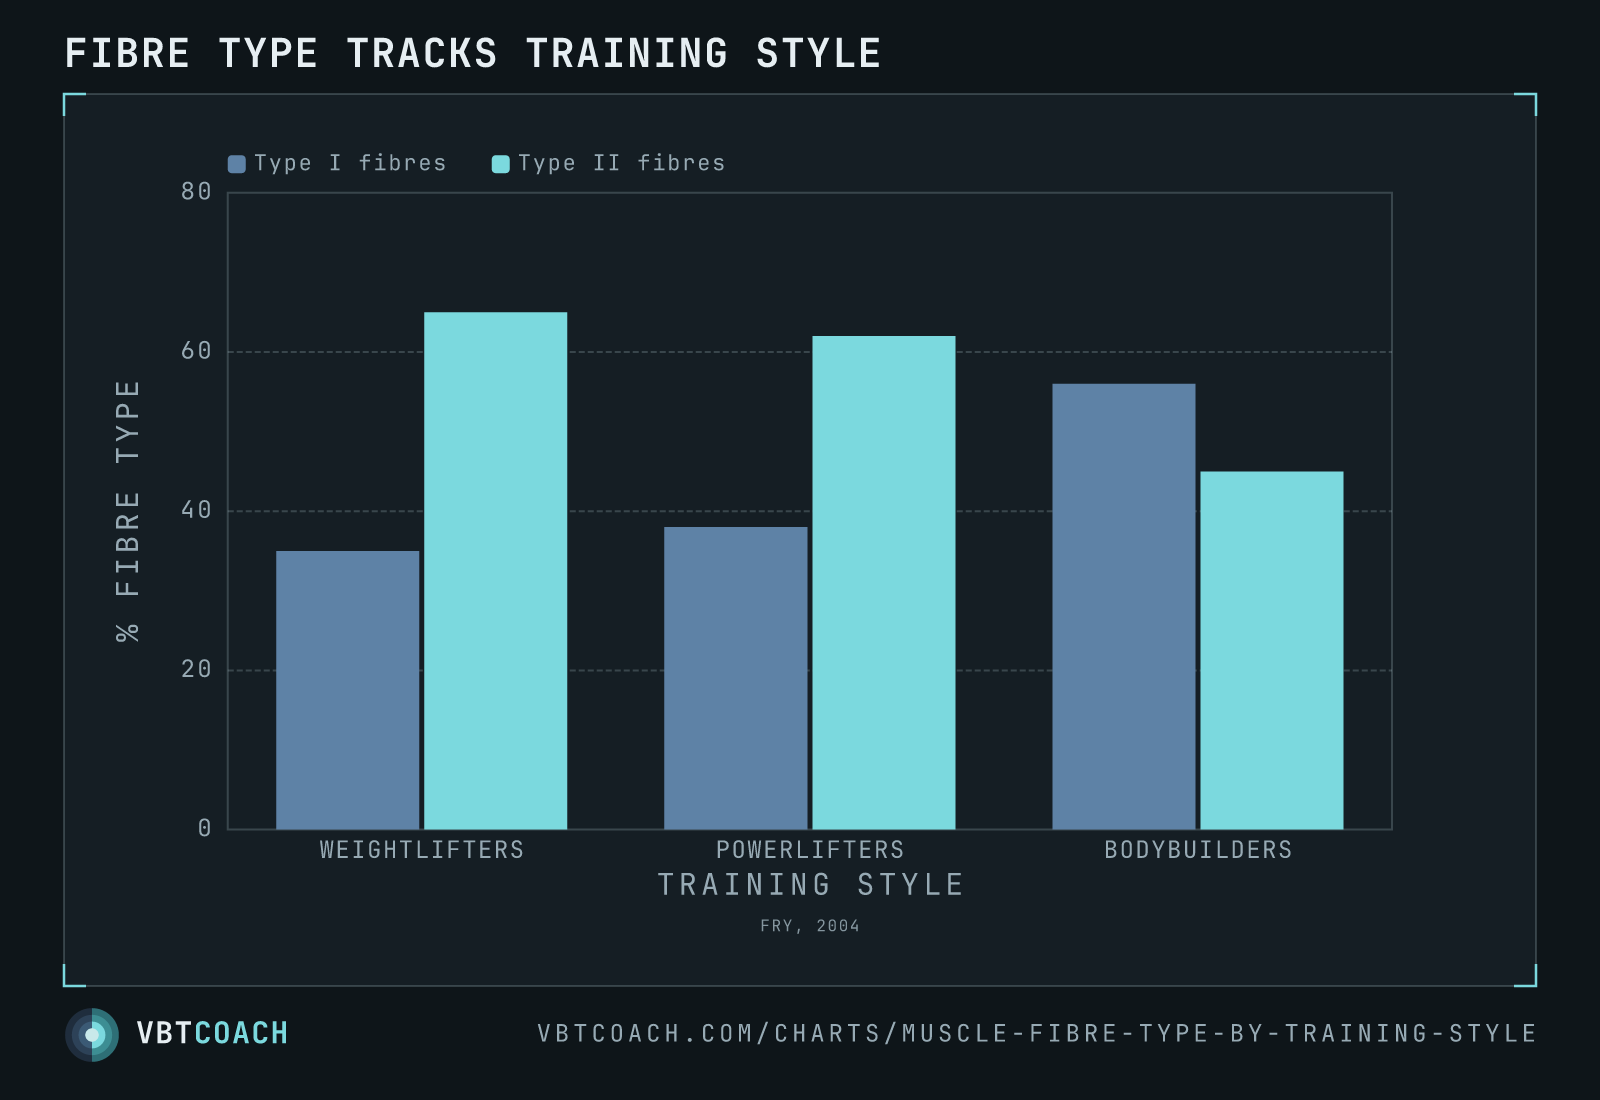
Fry 2004 — strength-and-power athletes (weightlifters, powerlifters) sit at ~65 % type-II fast-twitch; high-volume bodybuilders sit closer to 45 %. Selection × adaptation in one chart.
Fry’s 2004 review aggregated muscle-fibre-type distributions across three trained populations: weightlifters, powerlifters, and bodybuilders. The pattern is striking and stable across the literature. Strength-and-power athletes sit at roughly 65 % type-II (fast-twitch) fibres; bodybuilders sit closer to 45 %. The split is part selection (sports preferentially attract athletes with the right fibre composition) and part adaptation (the training preserves or shifts fibre distribution).
How to read this chart
Three training populations across the bottom: weightlifters, powerlifters, bodybuilders. Navy bars are type I (slow-twitch, oxidative, fatigue-resistant) fibre percentages. Teal bars are type II (fast-twitch, glycolytic, high-power) fibre percentages.
Weightlifters: 35 % type I, 65 % type II. The most fast-twitch dominant population, reflecting both the sport’s selection (slow-twitch athletes don’t snatch big weights) and its training (explosive lifts preferentially train type II).
Powerlifters: 38 % vs 62 %. Slightly less type-II dominant than weightlifters, but still firmly fast-twitch. Powerlifting trains heavy and slow but the heavy-and-slow grind still recruits high-threshold motor units (Henneman’s principle).
Bodybuilders: 56 % vs 45 %. Inverted relative to the strength-power groups. The high-volume, sub-failure-but-near-failure training of hypertrophy-focused programs shifts fibre composition toward type I — partly because the training itself drives fibre-type transitions, partly because successful bodybuilders may select toward better hypertrophy responders, who tend to be type-I dominant.
When to use this evidence
- Picking training emphasis by athlete type. A naturally type-I dominant lifter responds better to volume-and-tension work; a type-II dominant lifter responds better to explosive, low-volume work. The chart legitimises programming differences by population.
- Setting realistic strength-vs-size goals. A type-II dominant athlete with poor genetics for hypertrophy will always lift heavier than they look. A type-I dominant athlete will always look bigger than they lift.
- Reframing the “natural athlete” question. Some lifters never get strong with hypertrophy programs; others never get big on strength programs. The chart is one explanation: their fibre composition was always the dominant variable.
Selection vs adaptation
The chart can’t separate the two effects. Both are real:
- Selection. Sports preferentially retain athletes whose physiology matches the sport. A type-I dominant athlete who tries Olympic lifting plateaus early and switches to a sport that suits them. By the time you look at “weightlifters,” you’re looking at the survivors.
- Adaptation. Training shifts fibre distribution. Heavy fast-twitch work preserves type-II; heavy slow-twitch work shifts toward type-I. Even within one athlete, the fibre split a year into training is different from the split before they started.
The chart’s pattern is consistent with both forces pulling the same direction.
Pitfalls
- Population averages, not individuals. A weightlifter at 50 % type-II is still a weightlifter; a bodybuilder at 60 % type-II exists too. The distributions overlap heavily; the means just sit in different places.
- Biopsy method matters. Fibre-type measurement uses muscle biopsies, typically from vastus lateralis. Different muscles in the same athlete have different fibre splits.
- The data is from elite-level athletes. Recreational lifters of every type sit closer to general-population averages (~50/50). The selection effect is much weaker outside competitive sport.
Where to go next
For the underlying motor-unit recruitment story, see Henneman’s size principle and velocity-based training. For the practical implication on hypertrophy programming, VBT for bodybuilding and hypertrophy training covers how to bias volume vs intensity given an athlete’s response profile.
Download high res chart images
High-resolution PNG, 1600×1000, watermarked. Free to share, embed in slides, or print. Credit appreciated.