Post-activation potentiation and sprint speed — the group average
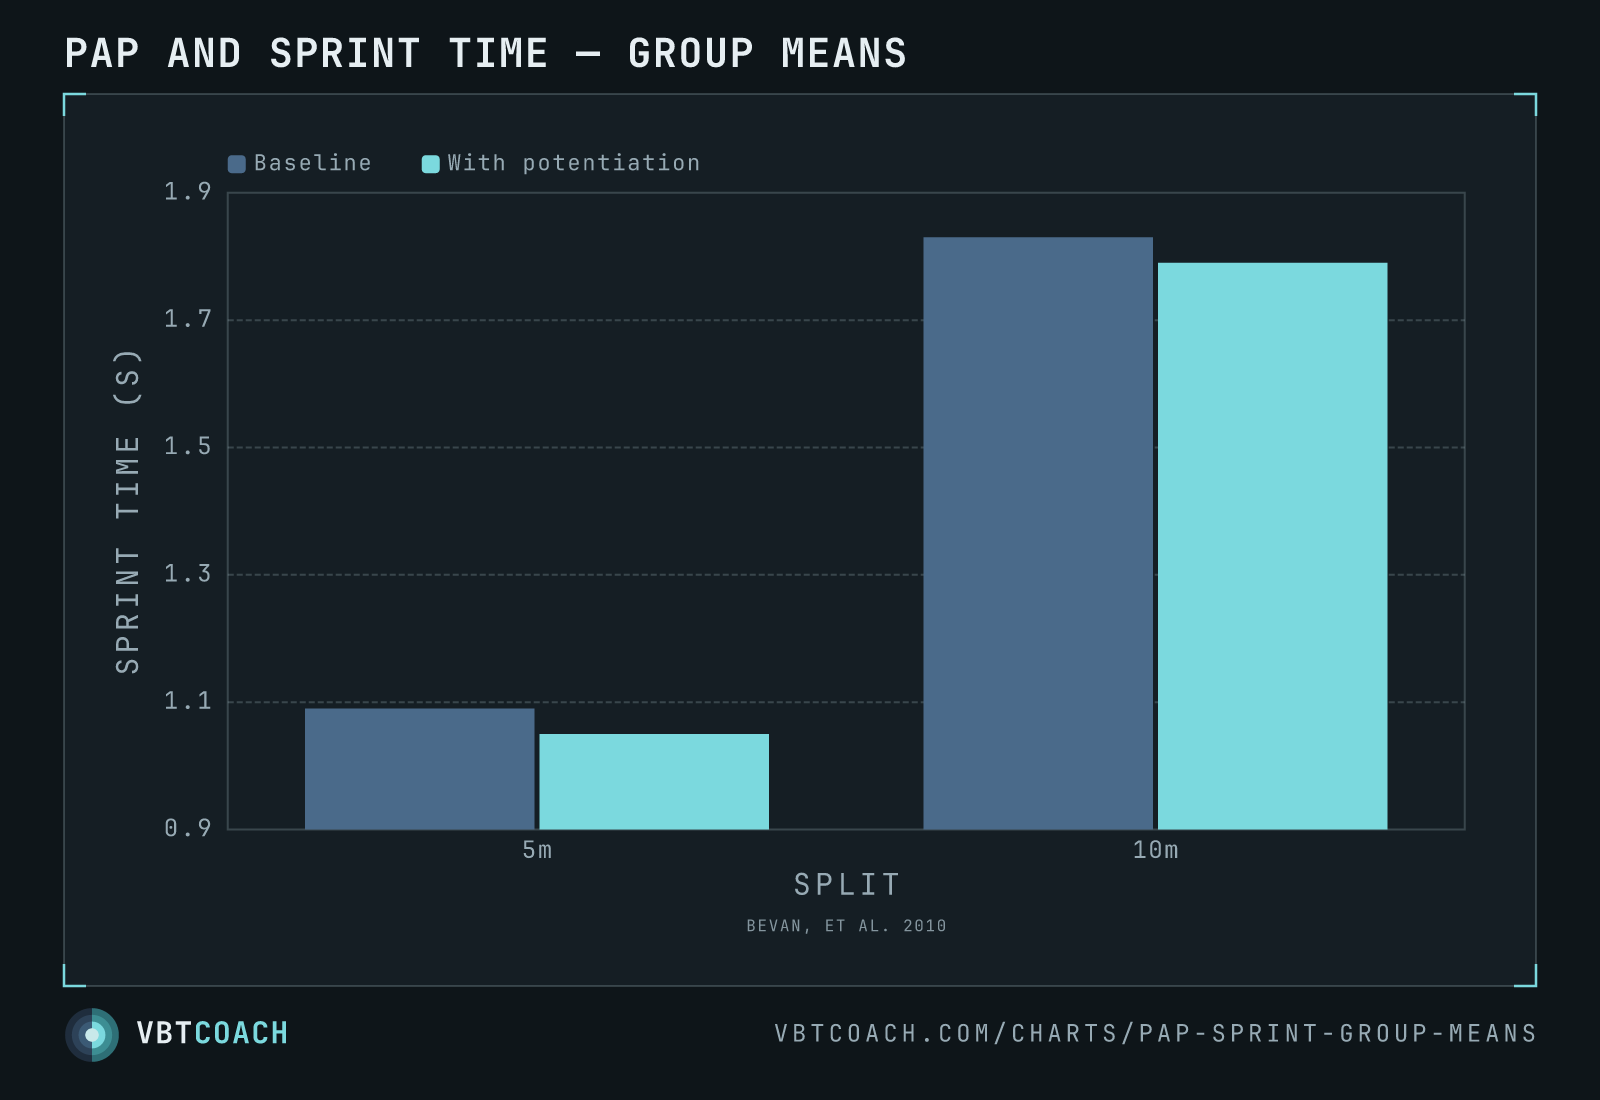
Bevan 2010 — 16 professional rugby players sprinted before and after 3 reps of squat at 91 % 1RM. The group got 0.04 s faster over both 5 m and 10 m.
Sixteen professional rugby players ran a 10 m sprint with a 5 m split, then squatted 3 reps at 91 % of 1RM, then sprinted again at 4, 8, 12 and 16 minutes. The idea is post-activation potentiation: a heavy set leaves the muscle both fatigued and potentiated, and once the fatigue clears the potentiation is still there.
Against each athlete’s best post-squat attempt, the group improved by 0.04 s over both splits — 5 m from 1.09 to 1.05 s (p = 0.007), 10 m from 1.83 to 1.79 s (p = 0.003).
Read the fine print before you use this
Two things about that comparison matter more than the bars.
“Best sprint” means best of four. Each athlete ran four post-squat sprints and the analysis takes their fastest. Baseline was a single attempt. Some of the 0.04 s is simply the best of four rolls of the dice against one — you would expect a best-of-four to beat a single trial even with no treatment at all.
The straight comparison found nothing. Before selecting each athlete’s best trial, a repeated-measures ANOVA across all timepoints showed no significant effect at either 5 m (p = 0.175) or 10 m (p = 0.401). The significant result appears only once individual best-response timing is taken into account.
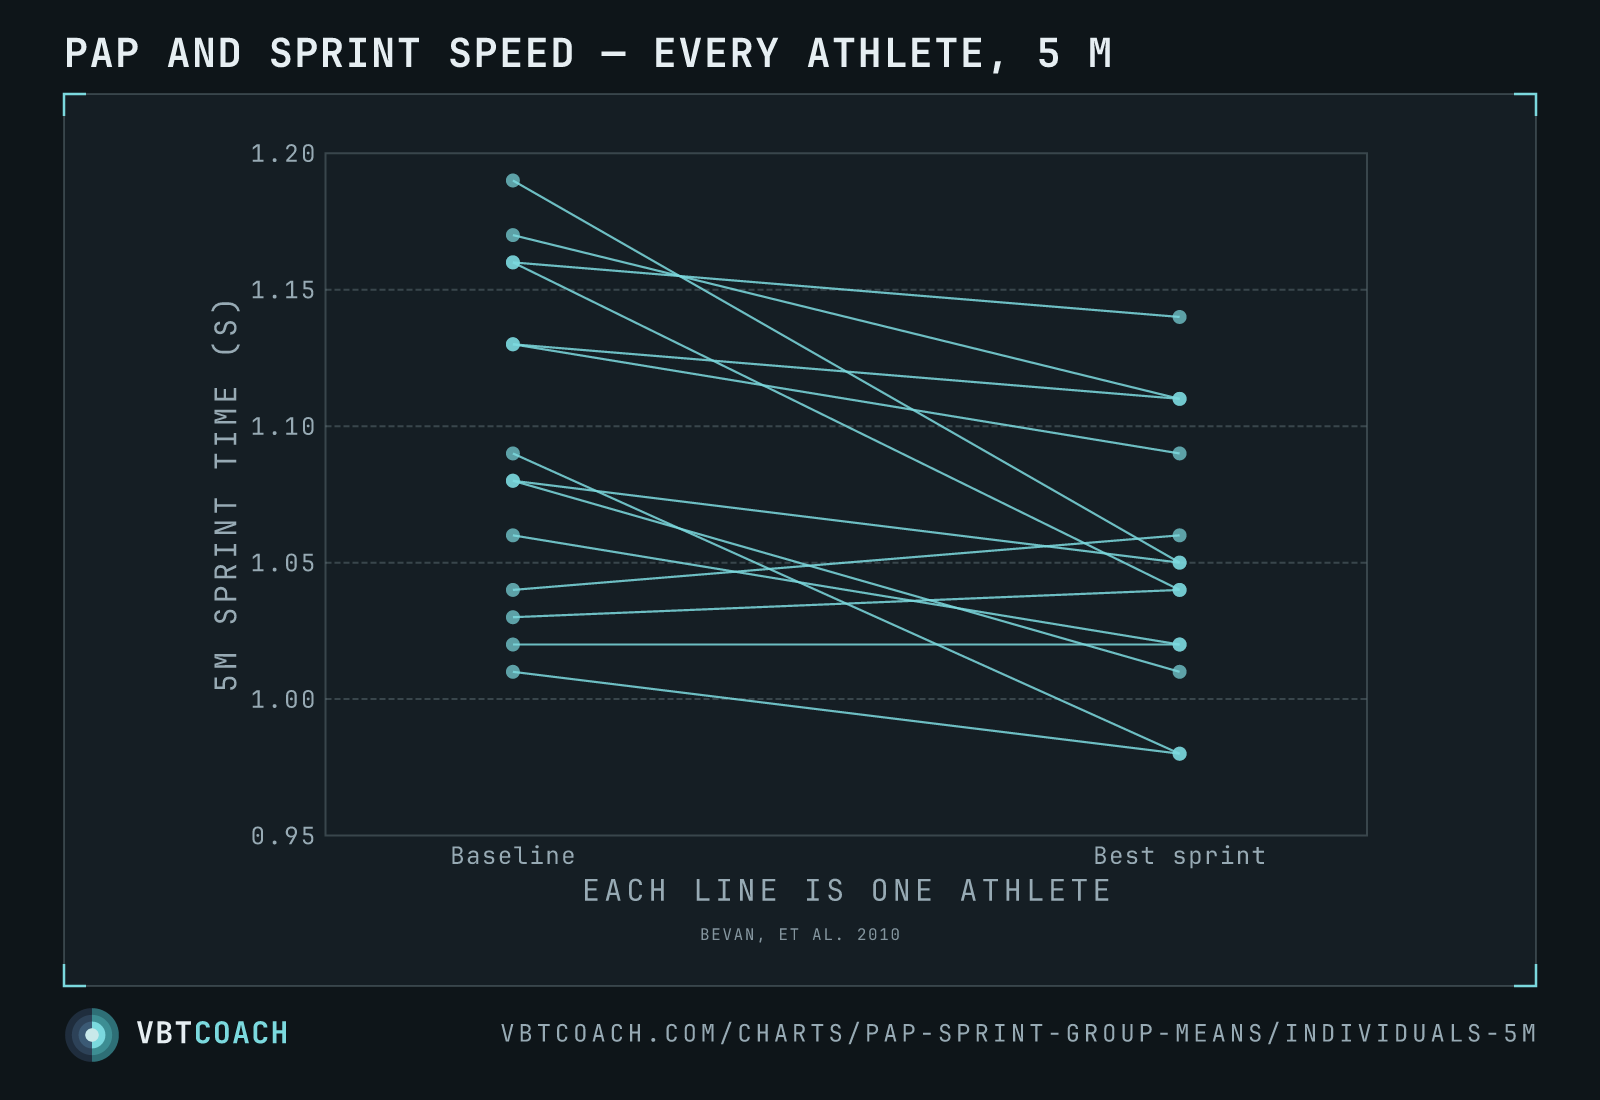
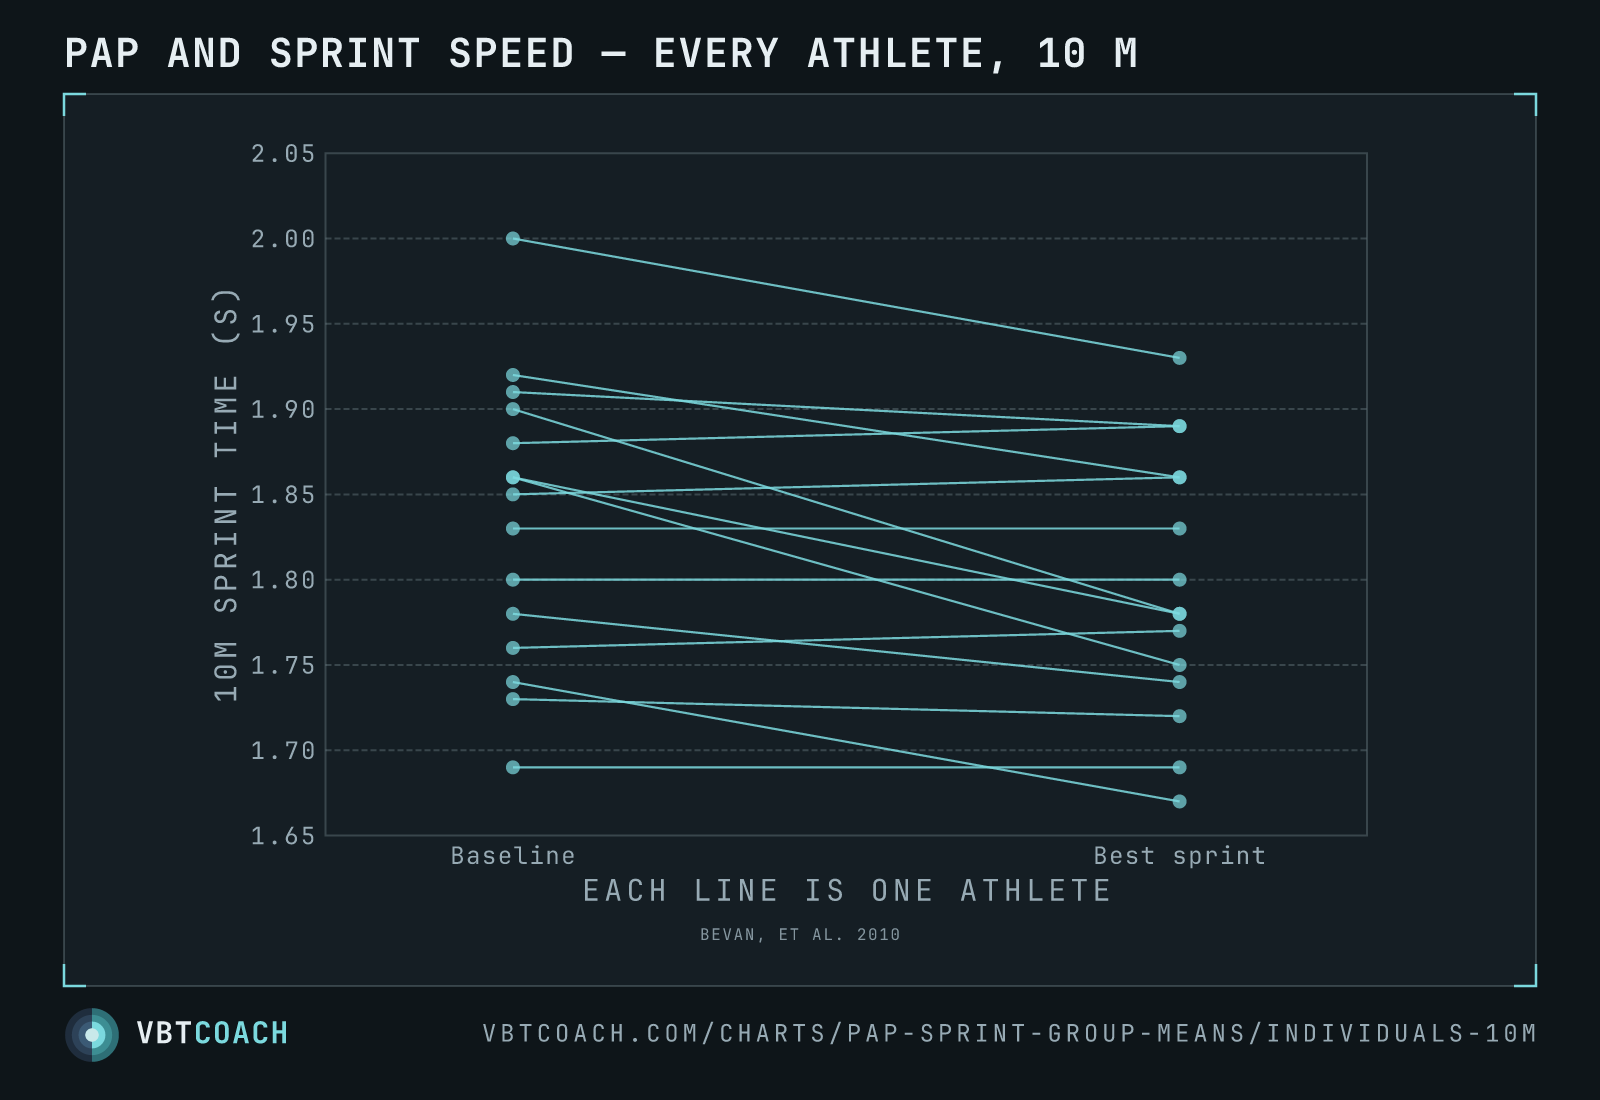
The averages hide the spread. The standard deviations — 0.06 and 0.05 s at 5 m, 0.08 s at both 10 m points — are larger than the 0.04 s effect. That is a clue that athletes did not all move in the same direction, which is exactly what the individual data shows.
What it’s good for
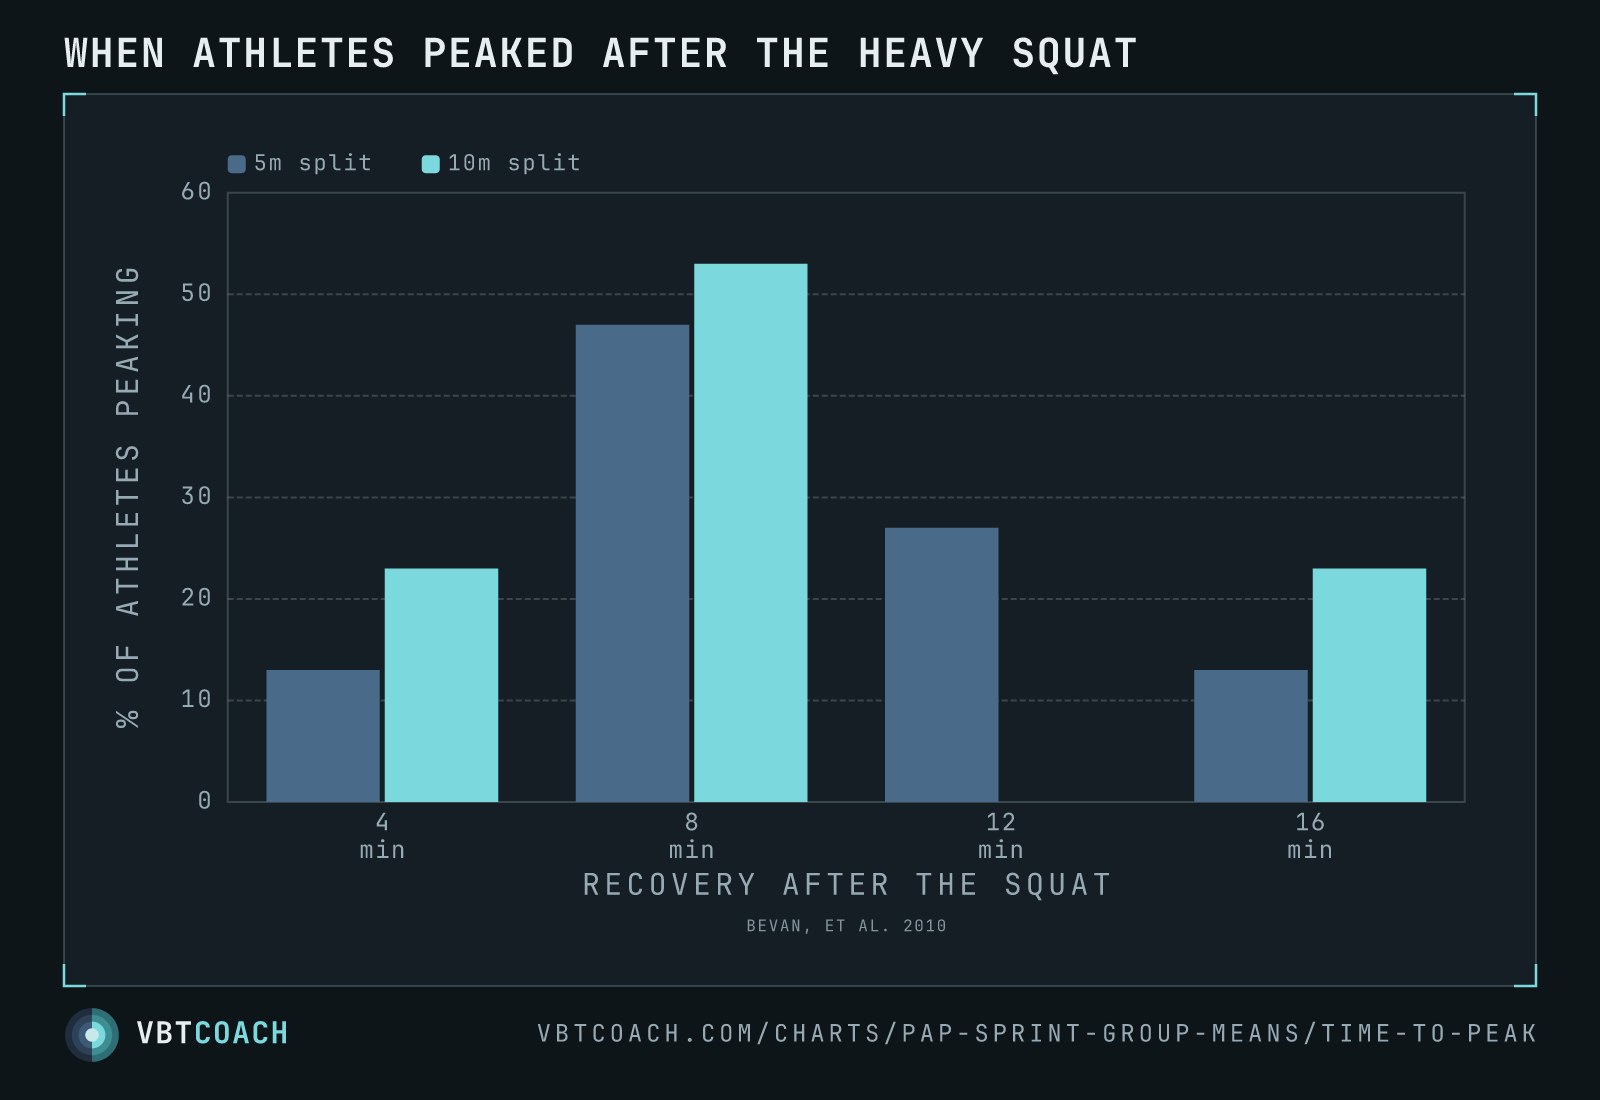
The practical finding worth keeping is about timing, not magnitude: 47 % of athletes ran their best 5 m at the 8-minute mark, and 53 % their best 10 m there. Too soon and fatigue still dominates; too late and the potentiation has faded. If you are going to use a heavy single or triple to prime a sprint, roughly 8 minutes of recovery is the window this study points to — and it needs to be found per athlete, not assumed.
Download high res chart images
Every chart on this page as a high-resolution PNG — 4 exports, 1600×1000, watermarked. Free to share, embed in slides, or print. Credit appreciated.