Proximity to failure & fatigue chart
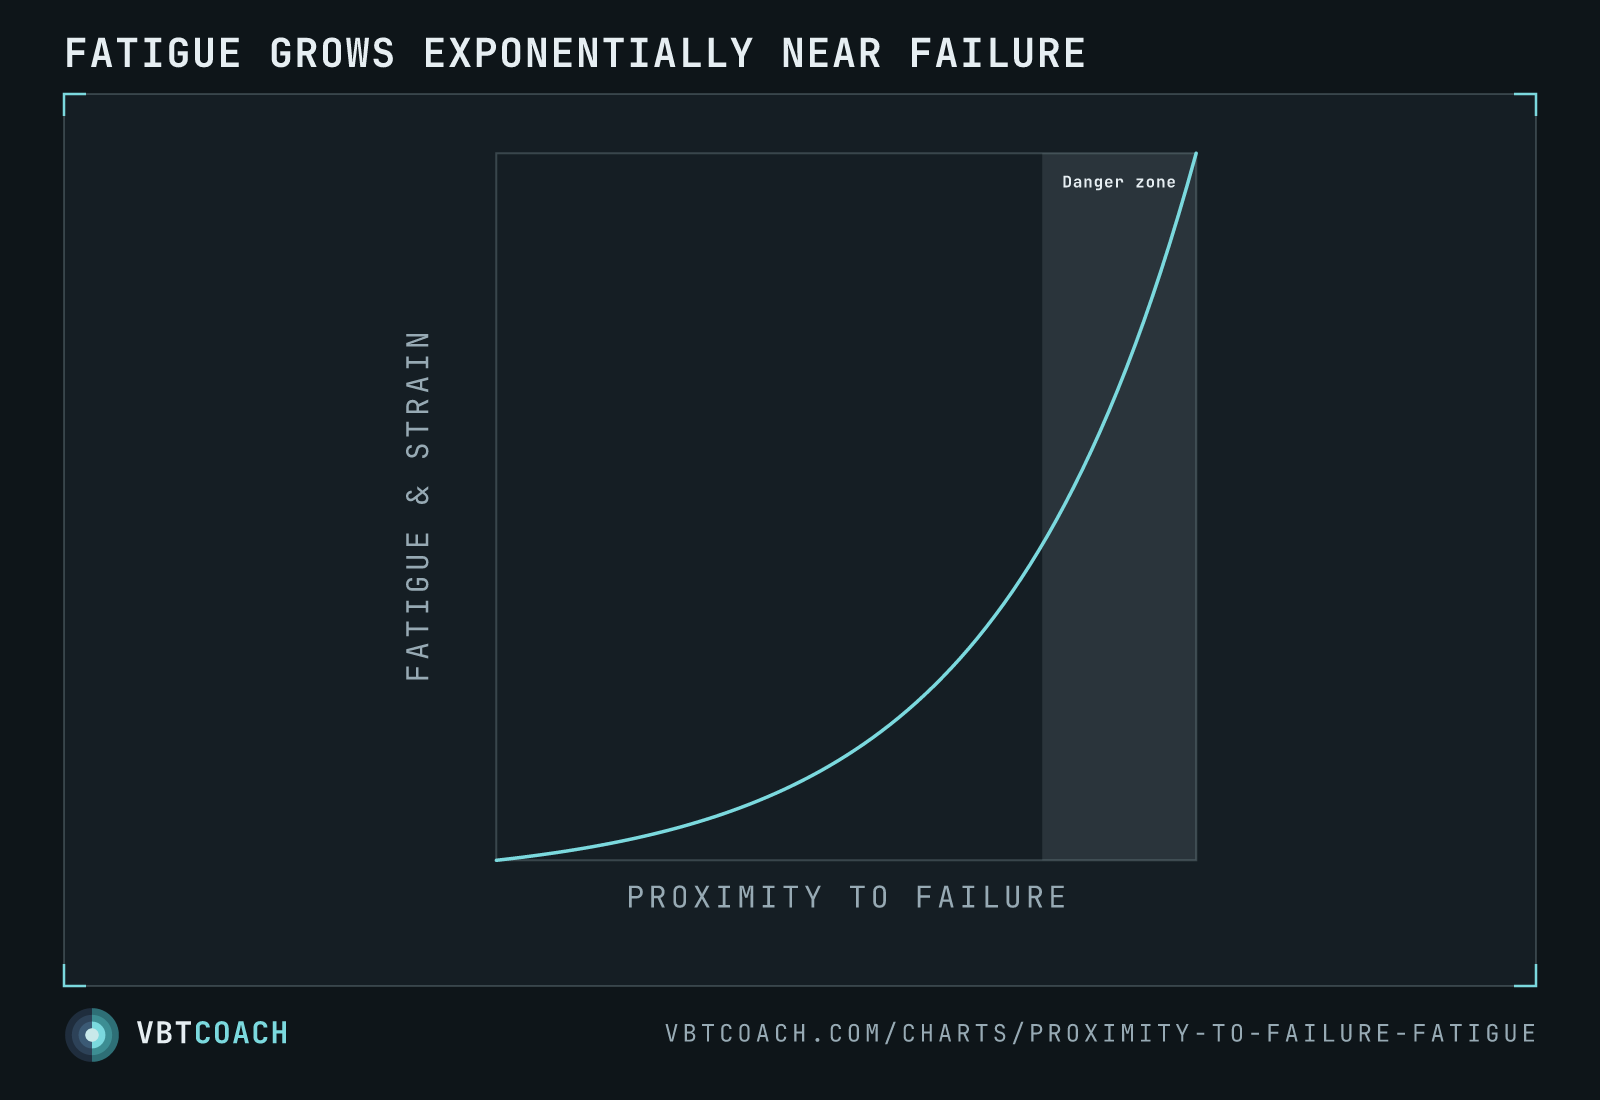
Conceptual exponential curve showing how fatigue accumulation rises steeply as a set approaches the point of failure. The "danger zone" near 100 % proximity is where most of the systemic cost is paid.
The cost of training closer to failure isn’t linear — it’s exponential. The first few reps of a set are cheap; the last few are expensive. The shaded “danger zone” near 100 % proximity is where each additional rep produces disproportionately more fatigue, longer recovery requirements, and (past a certain point) negative net adaptation.
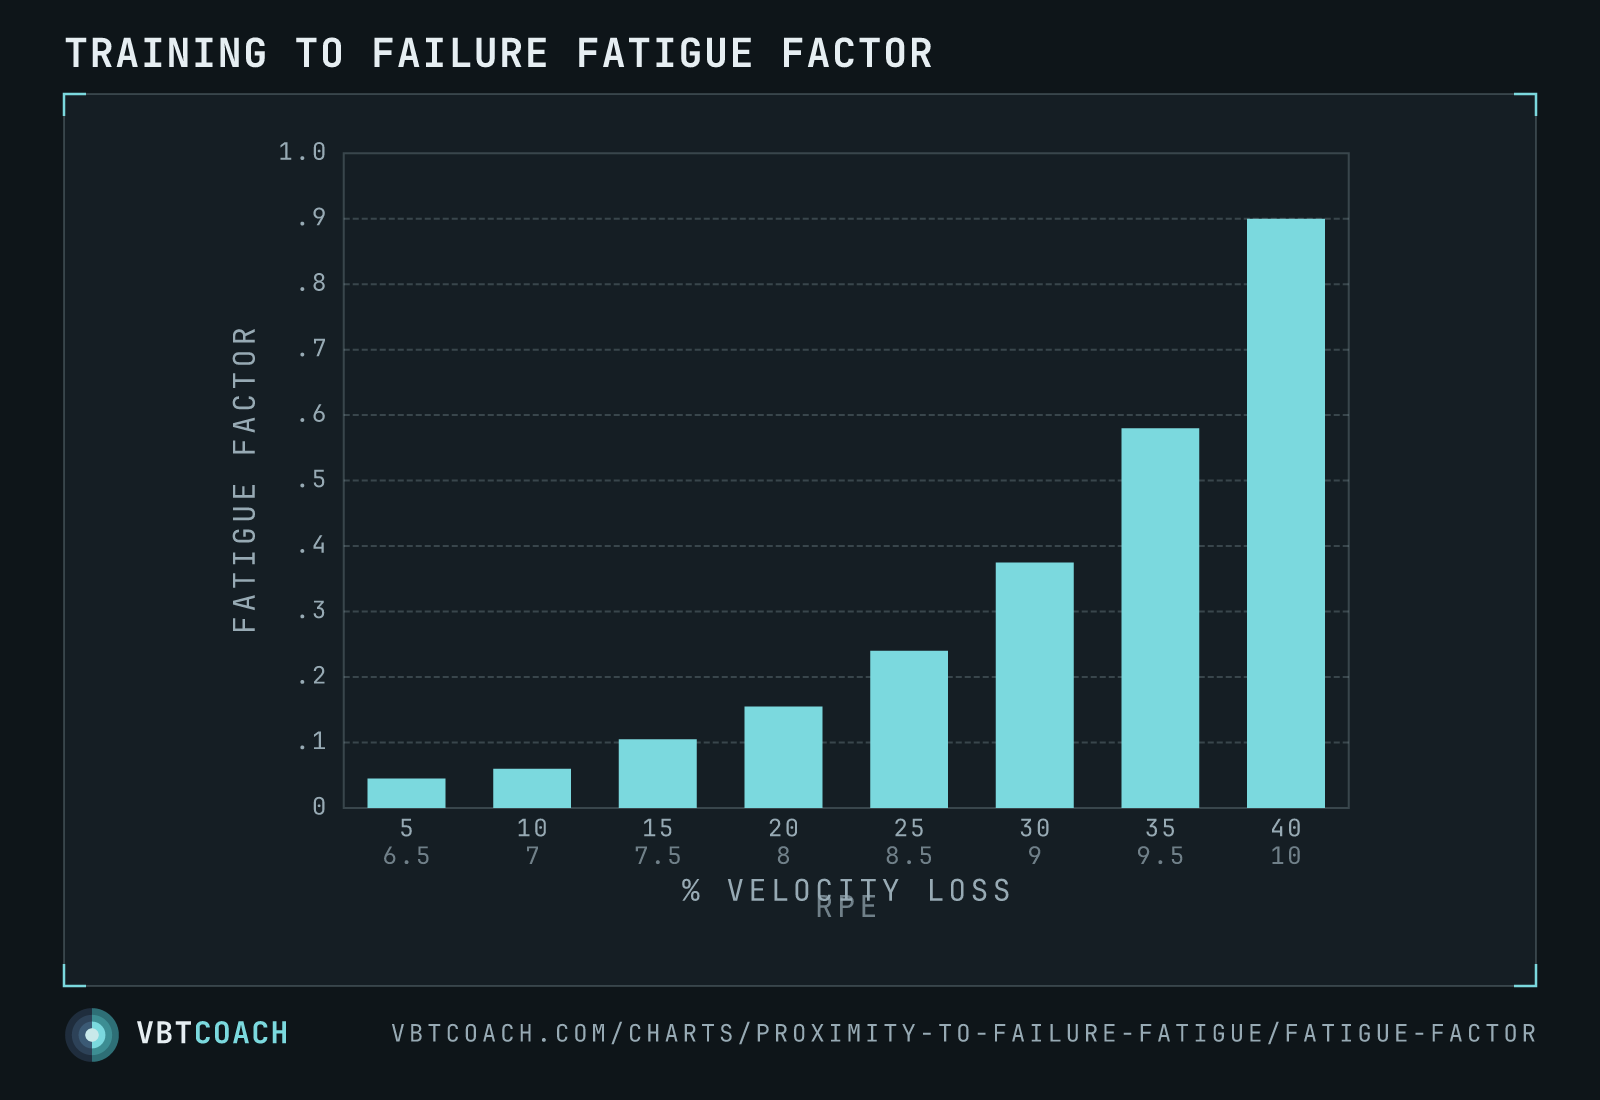
Use the curve as a framing device when discussing intent: most working sets should sit comfortably in the left-to-middle portion (RPE 7–8, 10–25 % velocity loss), with occasional dips into the danger zone reserved for peaking phases or specific test sets.
Download high res chart images
Every chart on this page as a high-resolution PNG — 2 exports, 1600×1000, watermarked. Free to share, embed in slides, or print. Credit appreciated.