RPE conversion chart — RPE, RIR, velocity loss, last-rep velocity
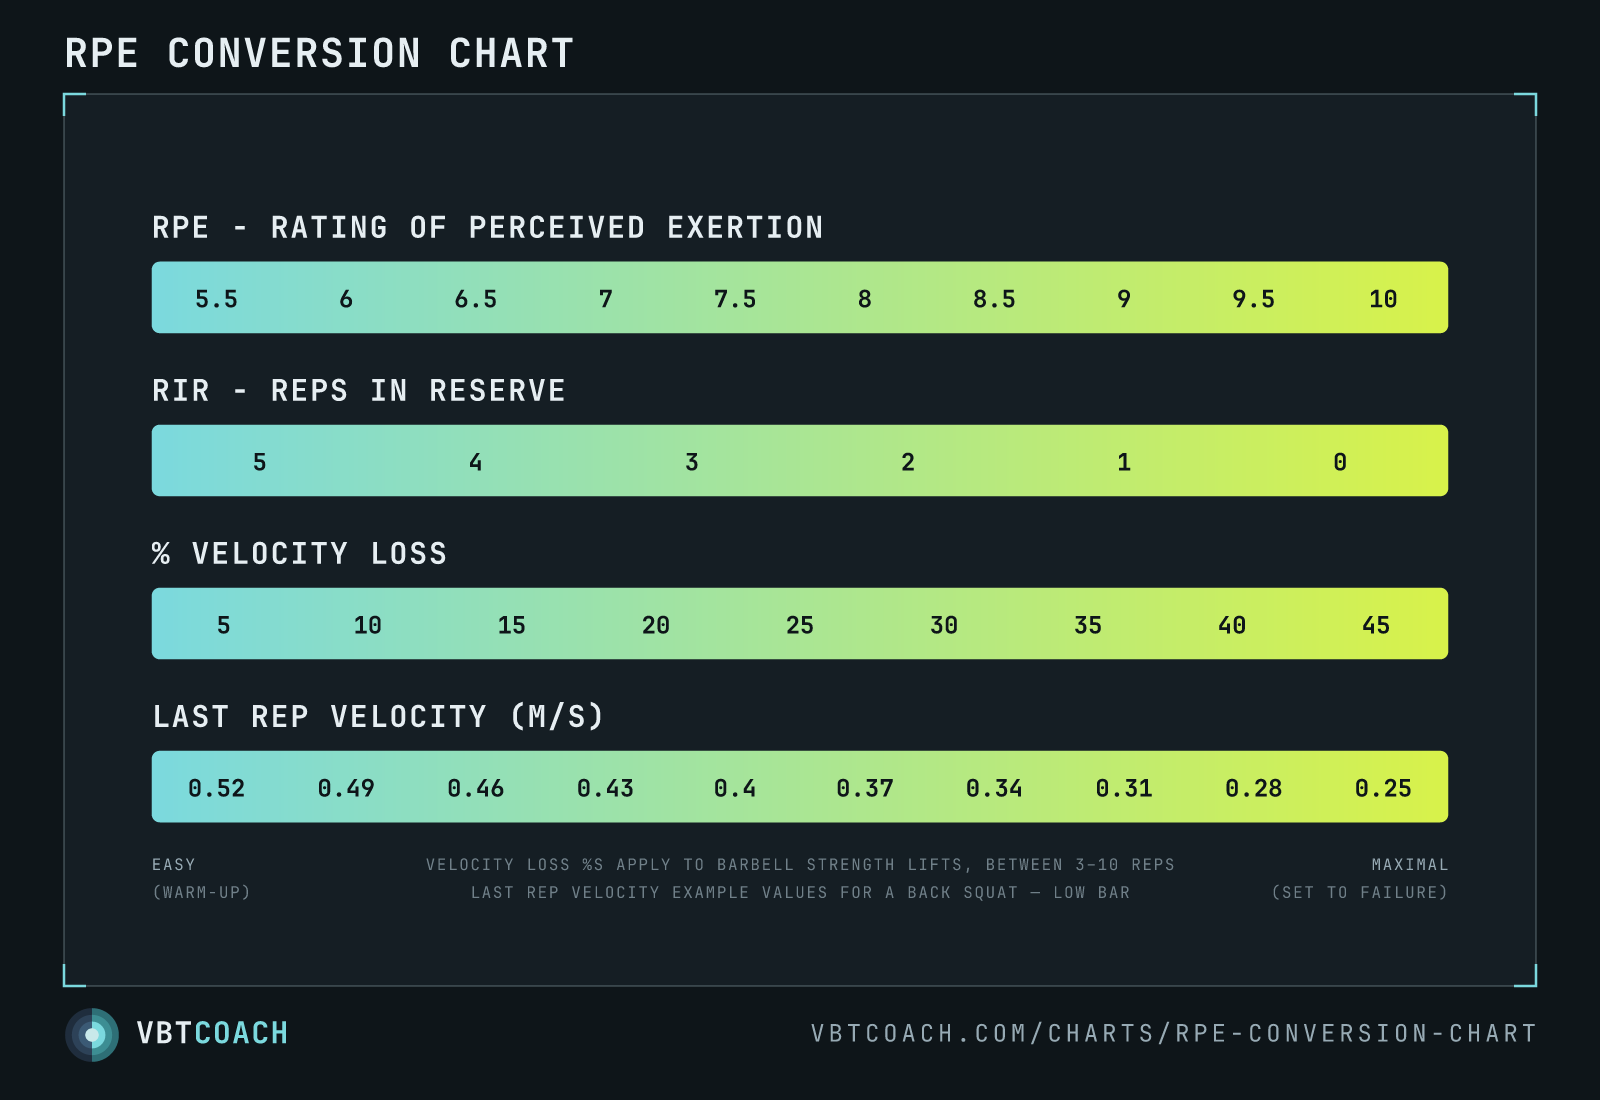
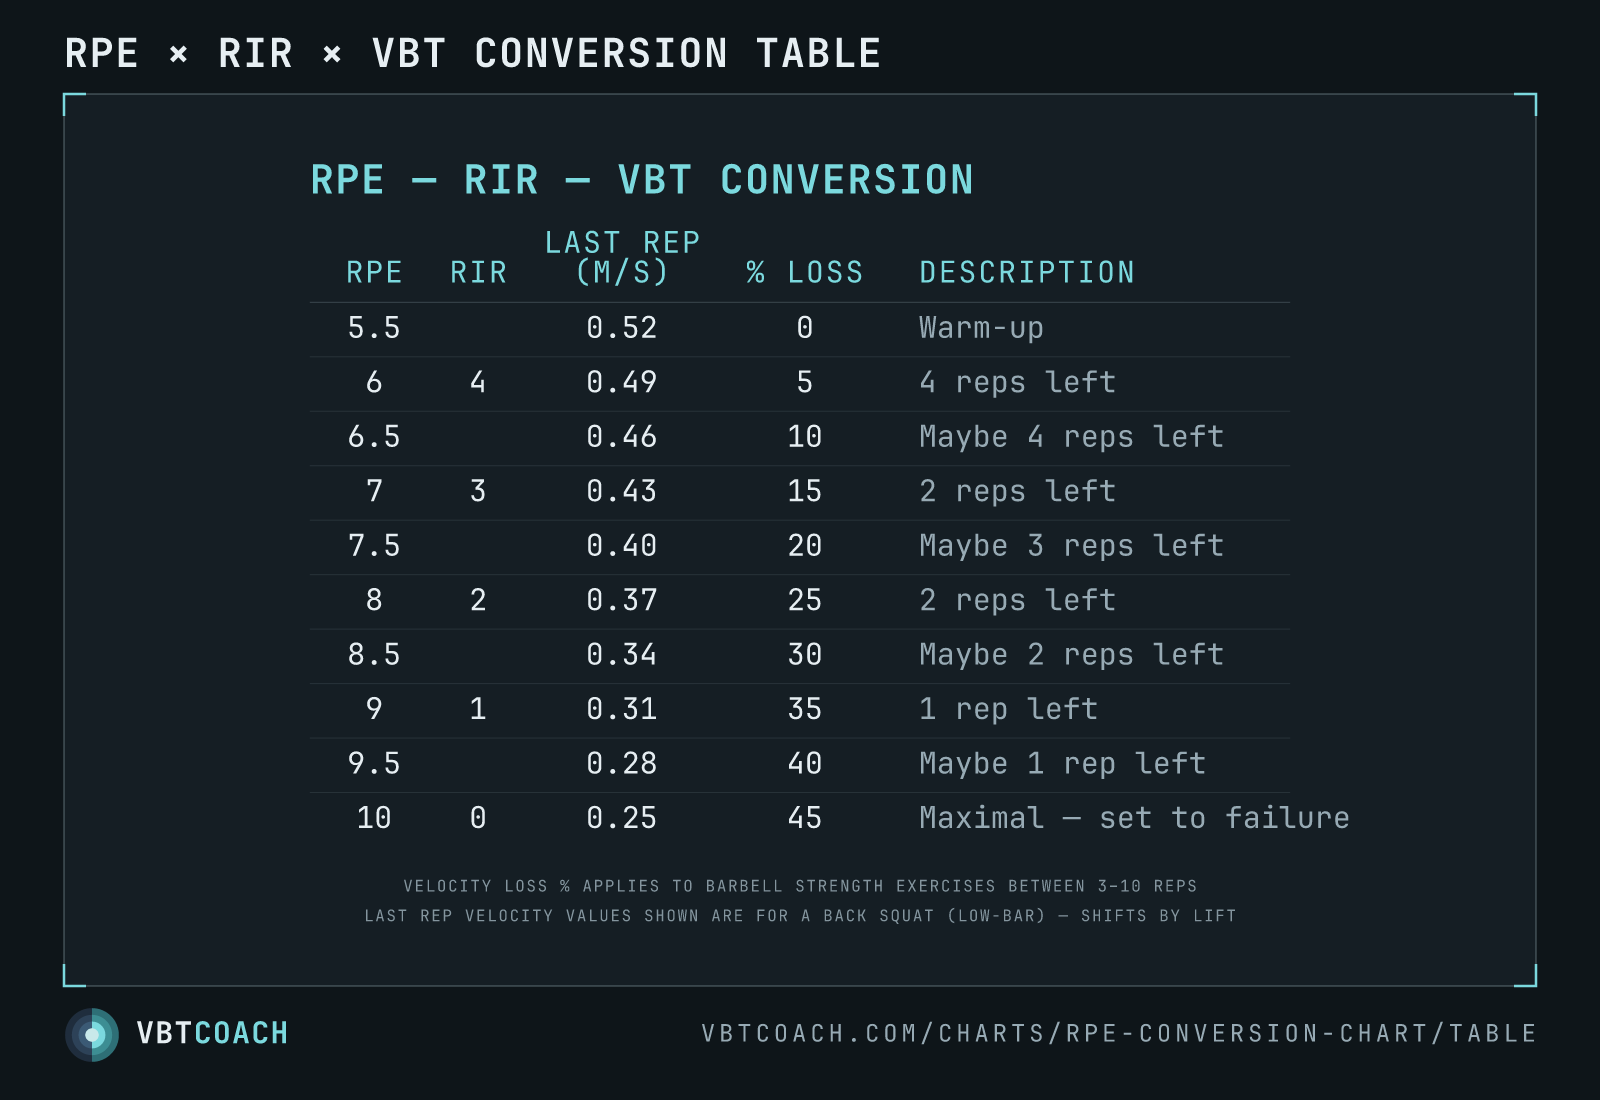
All four common effort languages on one chart — RPE 5.5–10, RIR 5–0, velocity loss 5–45 %, last-rep velocity 0.52–0.25 m/s. Drop a finger on any row to read across.
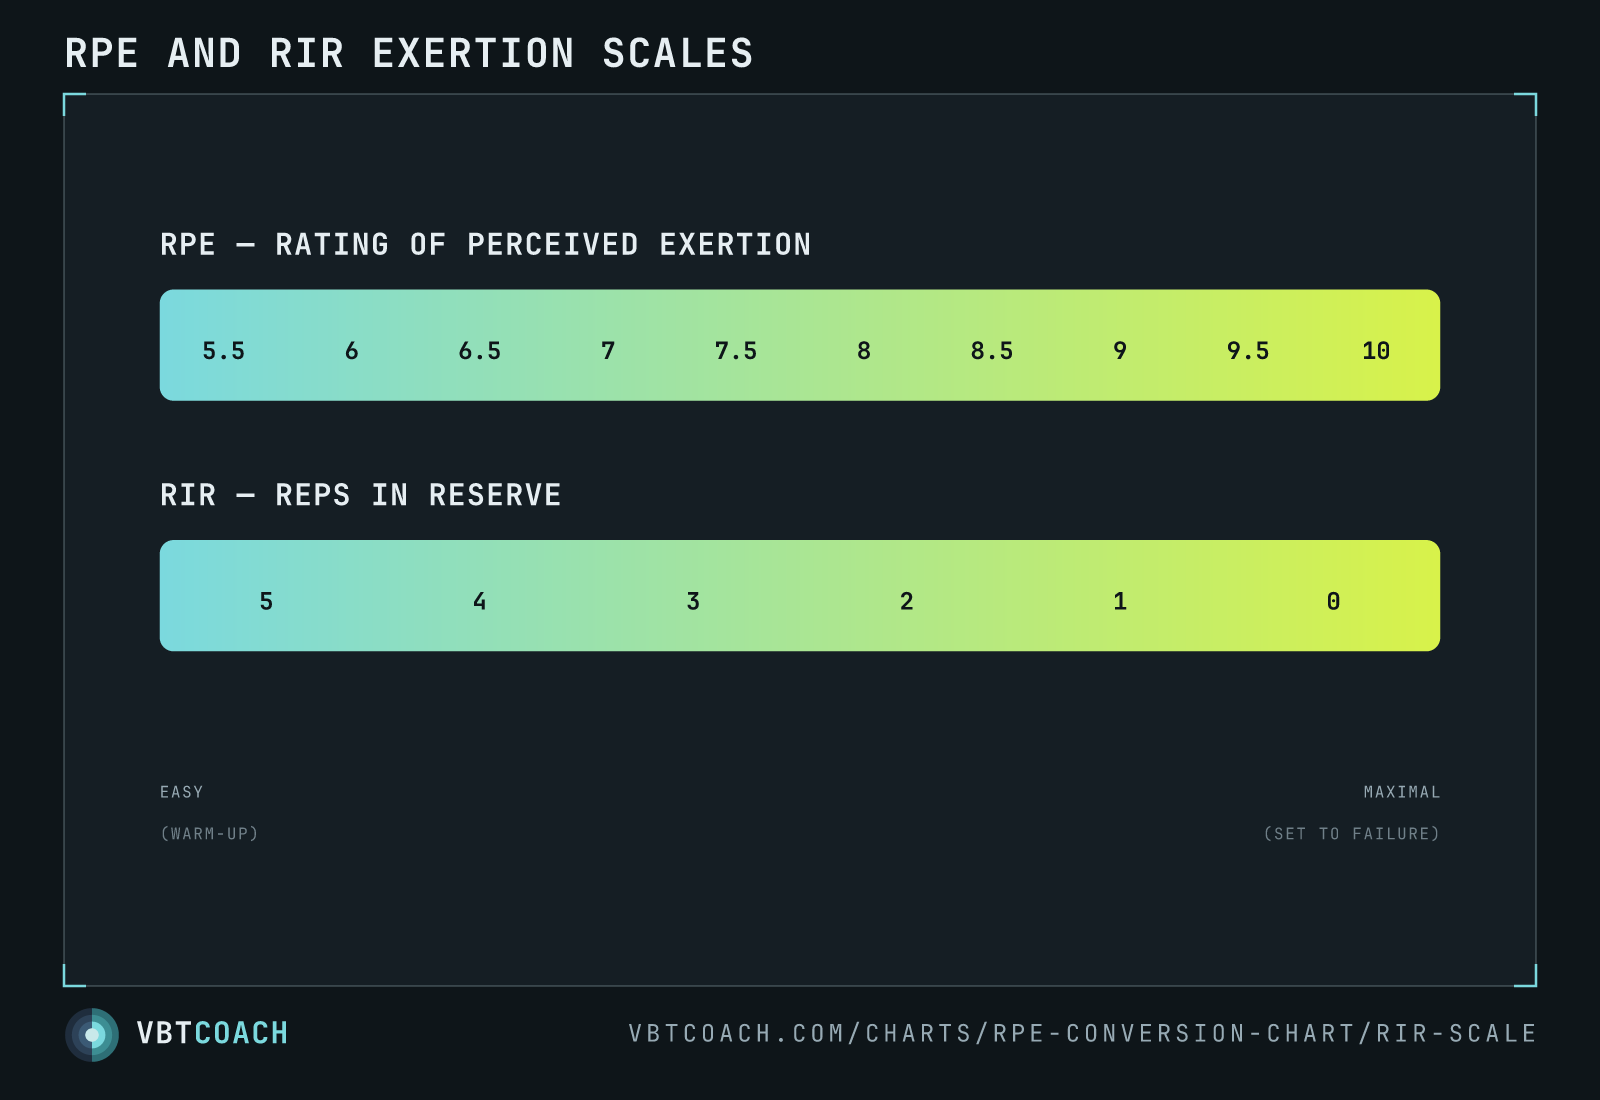
Four scales for the same dimension — perceived exertion, reps in reserve, percentage velocity loss, and the velocity of the final rep. They all measure how close a set was to failure; they just use different units. Stacked side-by-side on the same easy → maximal axis, a finger drop in any bar shows the matching value in the other three.
Use as a coaching reference when programs written in one language land with athletes who learned a different one — or when you’re combining objective (velocity loss / last-rep velocity) and subjective (RPE / RIR) measures in the same session. Velocity numbers shown are back-squat (low-bar) reference; the shape generalises, the absolute values shift by lift.
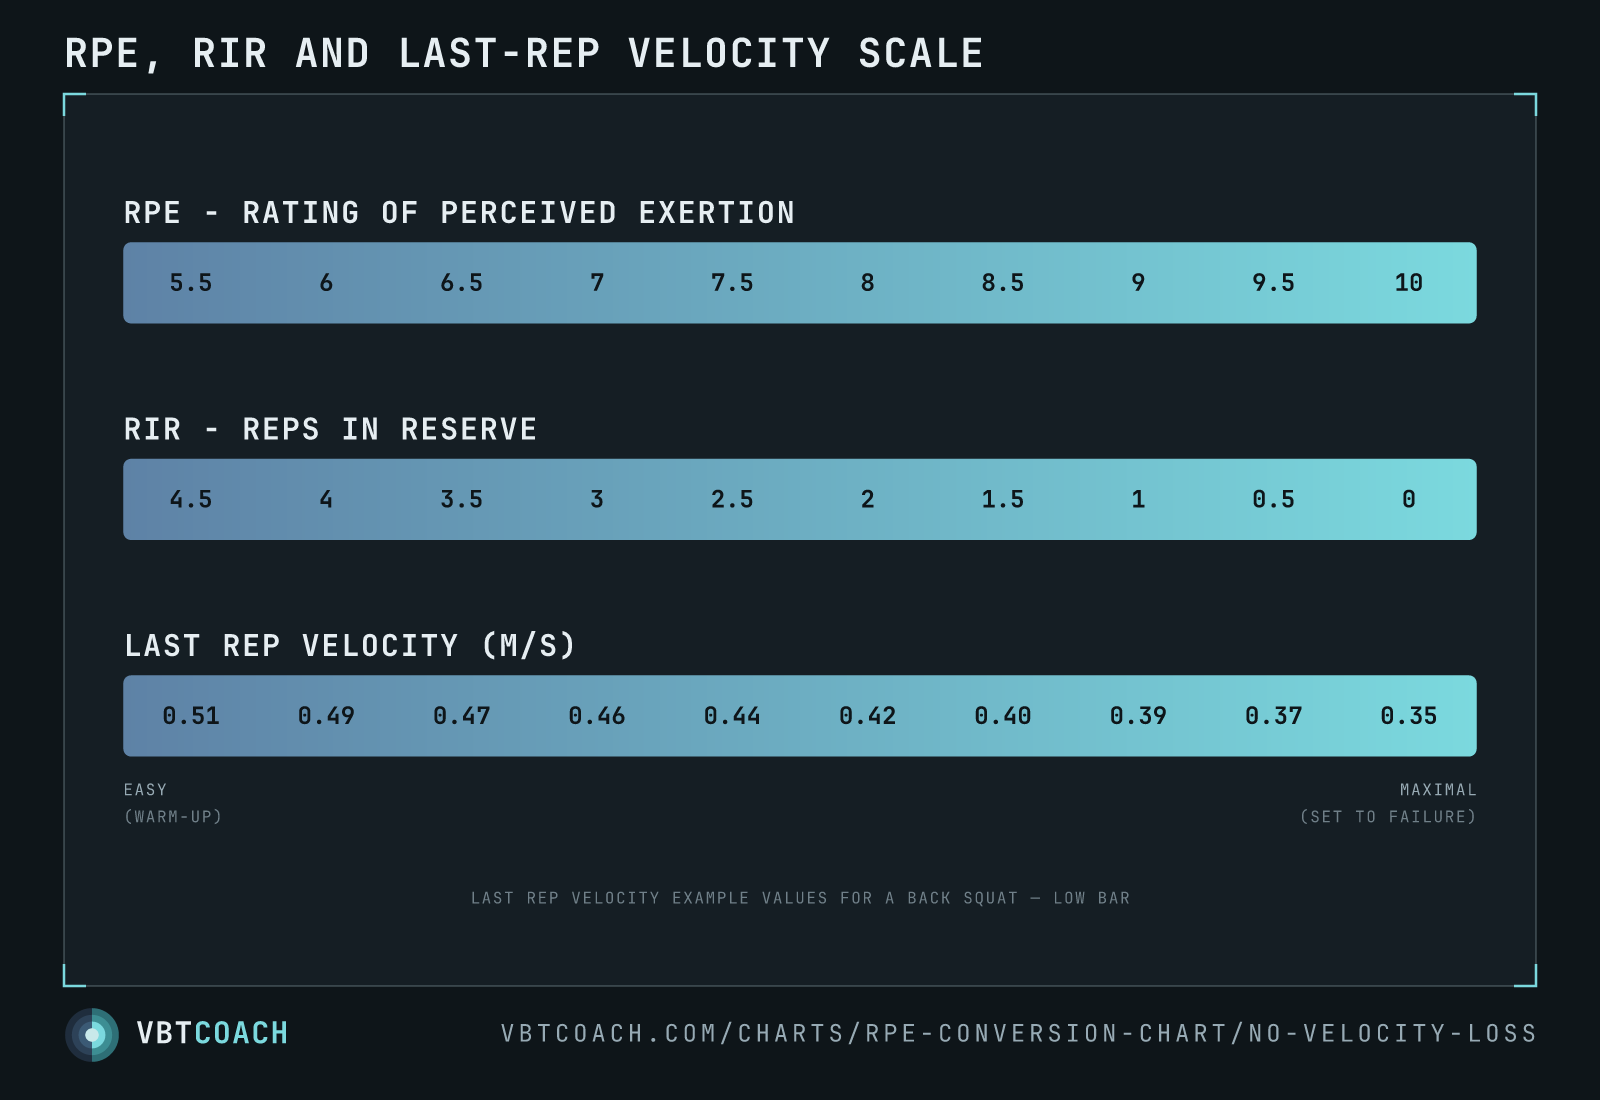
Without the velocity-loss row
Velocity loss is the odd one out on the four-bar chart. RPE, RIR and last-rep velocity are all read off the last rep — one number, available the moment the set ends. Velocity loss is a property of the whole set, it needs a reference rep to measure against, and the percentages only behave between roughly 3 and 10 reps.
So when the chart is doing its main job — translating a prescription for an athlete mid-session — the three-bar version is the cleaner tool. Reach for the four-bar chart when you’re programming set-level fatigue caps and want to see where a 20 % loss sits against an RPE 8.
Download high res chart images
Every chart on this page as a high-resolution PNG — 4 exports, 1600×1000, watermarked. Free to share, embed in slides, or print. Credit appreciated.