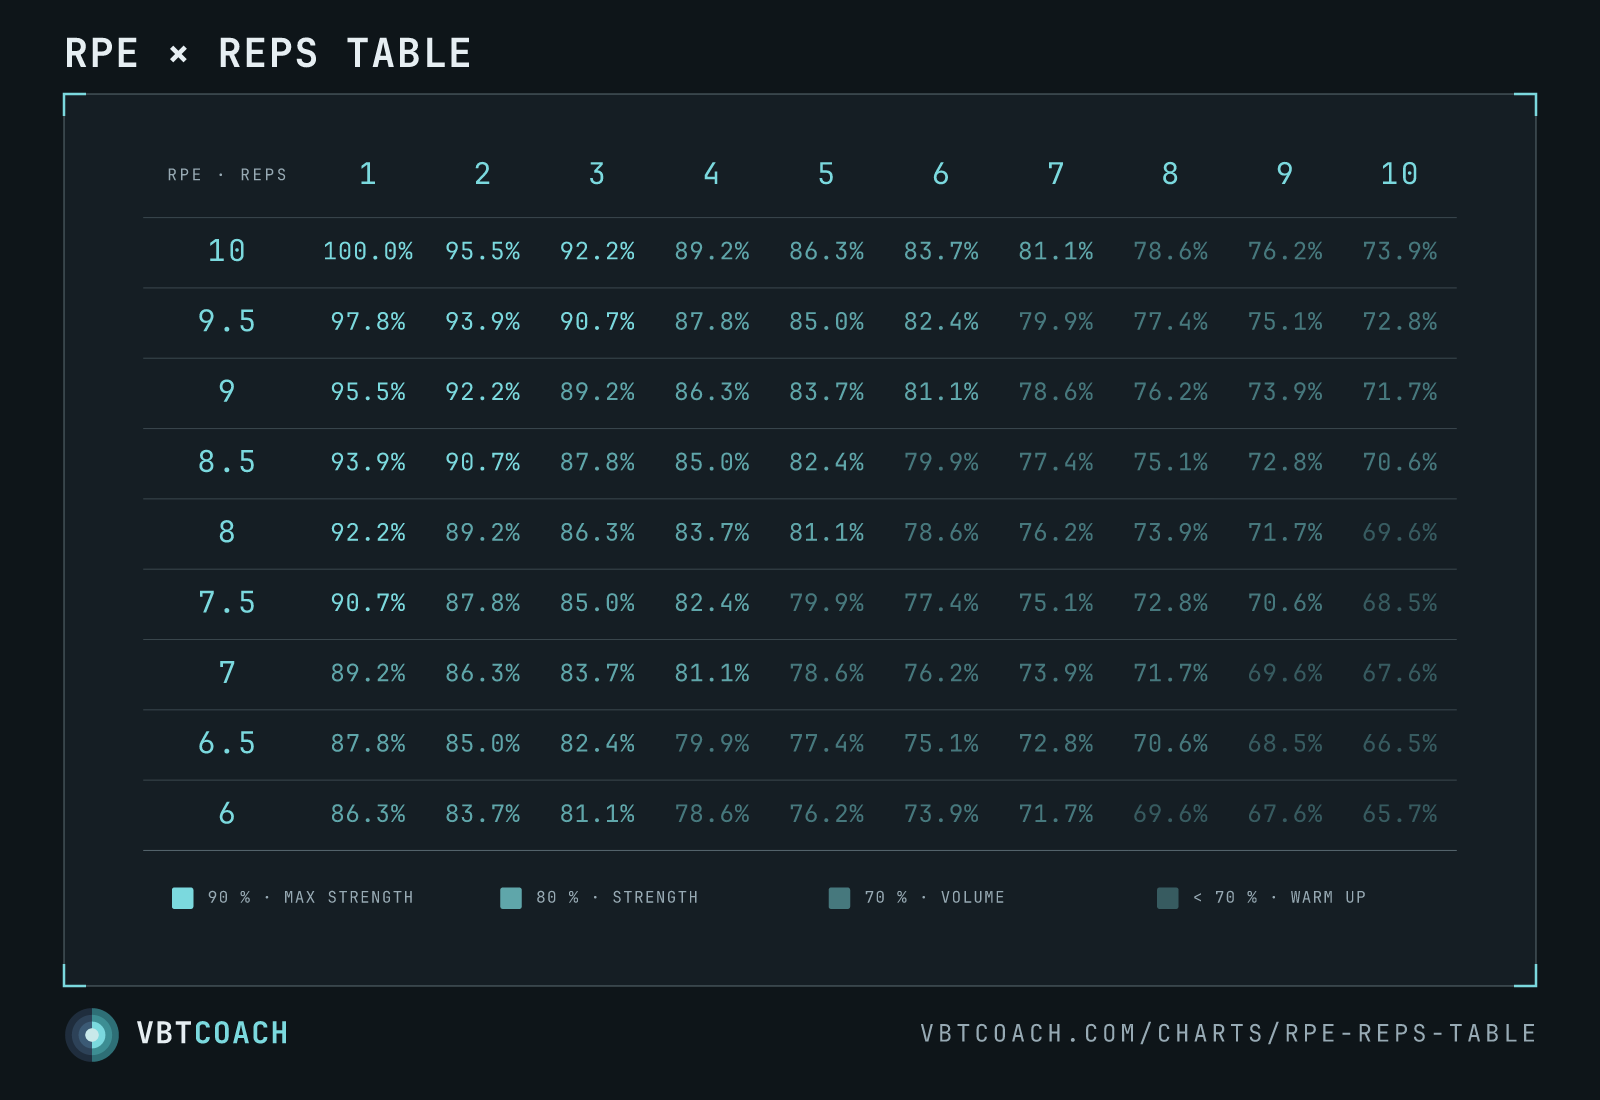
RPE × reps chart — the percentage of 1RM at every effort and rep count
Percentage of 1RM at every RPE × rep combination. Coaches use it forward (load → effort) and backward (effort → load), in both directions every session.
The RPE × reps percentage table answers a single question: “What % of my 1RM should this load be if I’m hitting RPE X for Y reps?” Coaches use it backwards too — “I want 5 reps at RPE 8 today; what load is that?” One small grid, one entire intensity language for a session.
How to read this chart
Each row is an RPE — 10 (max effort, no reps in reserve) down to 6 (four reps in reserve) in 0.5 increments. Each column is the rep count of the set, 1 through 10. Each cell is the percentage of your 1RM you’d need to load to grind out that rep count at that effort level.
The cells are heat-coloured so intensity zones jump out at a glance. Solid teal cells sit at ≥ 90 % — top-end strength loads, low rep counts at high RPE. Lighter teal cells are 80–90 %, the working-strength range. White cells are 70–80 %, the volume / hypertrophy zone. Dim cells are below 70 %, the capacity / metabolite range.
The diagonals matter: pick any cell, slide one row down and one column right, and you land on a cell with a very similar percentage. That’s because adding one rep at the same load roughly equates to dropping 0.5 RPE — the table is a 2-axis encoding of a single intensity dimension.
When to use it
- Programming working sets. “5 × 5 at RPE 8” → row RPE 8, column 5 → 81.1 % 1RM. Drop in your 1RM, get the load.
- Auto-regulating mid-session. If yesterday’s RPE 8 single landed at 86 %, you can find today’s matching effort across rep counts without guessing.
- Translating between programs. A program written in 5 × 5 @ RPE 8 is the same as one written at “81 %” — the table is the bridge.
- Building a velocity-calibration baseline. Pair with the last-rep velocity converter to map RPE → bar speed per lift.
Common variations
The values follow the standard RTS / Tuchscherer table — fitted to powerlifting bench, squat, and deadlift. Olympic lifts, single-leg variants, and strict press all run different curves: typically steeper (you lose more % per rep) because technique cost rises faster with fatigue. For accessory lifts the table over-estimates load capacity at high reps; trust the bar.
Lifter background shifts it too. Newer lifters often perceive RPE 8 at what’s mechanically RPE 9 — they aren’t yet calibrated. Use the table as a starting prescription and re-anchor after 2–3 weeks of velocity-tracked sessions.
Pitfalls
- Treating cells as exact. Day-to-day variation is ±2–3 % easily. The table is a starting point, not a target.
- Using it on lifts it wasn’t fit on. If your goal lift is overhead press or front squat, expect the curve to be steeper than the table suggests.
- Confusing RPE with reps in reserve. RPE 9 = 1 RIR, RPE 8 = 2 RIR, etc. Some lifters internalise one and not the other; pick a vocabulary and stick with it.
Reps-to-1RM shortcut
When you don’t have an RPE judgement and only the rep count actually achieved, the same idea collapses onto a single dimension. Take any rep-max set to true failure, multiply the load by the corresponding x-factor, and you have a 1RM estimate without the RPE step:
Reading is direct. Forward: “I just hit 8 reps to failure with 100 kg → my 1RM ≈ 100 × 1.25 = 125 kg.” Backward: “I want to train at 85 % 1RM → that’s the load that lets me hit 6 reps to failure.” The table reads the same way the RPE × reps chart does — both encode the same underlying load-fatigue relationship; this version just drops the RPE dimension and assumes every set was taken to failure.
The same caveats apply: lift-specific (powerlifting-fitted), trained-population baseline, and ± 2–3 % day-to-day noise. Newer lifters often think they took a set to failure but stopped a rep or two short — for them the percentages estimate slightly low.
Where to go next
For an interactive version (drop in your 1RM, get every load), use the RPE 1RM calculator. To calibrate RPE against bar speed on your specific lifts — the next layer of precision — see the RPE → velocity converter and our topic page on intent and effort.
Download high res chart images
High-resolution PNG, 1600×1000, watermarked. Free to share, embed in slides, or print. Credit appreciated.