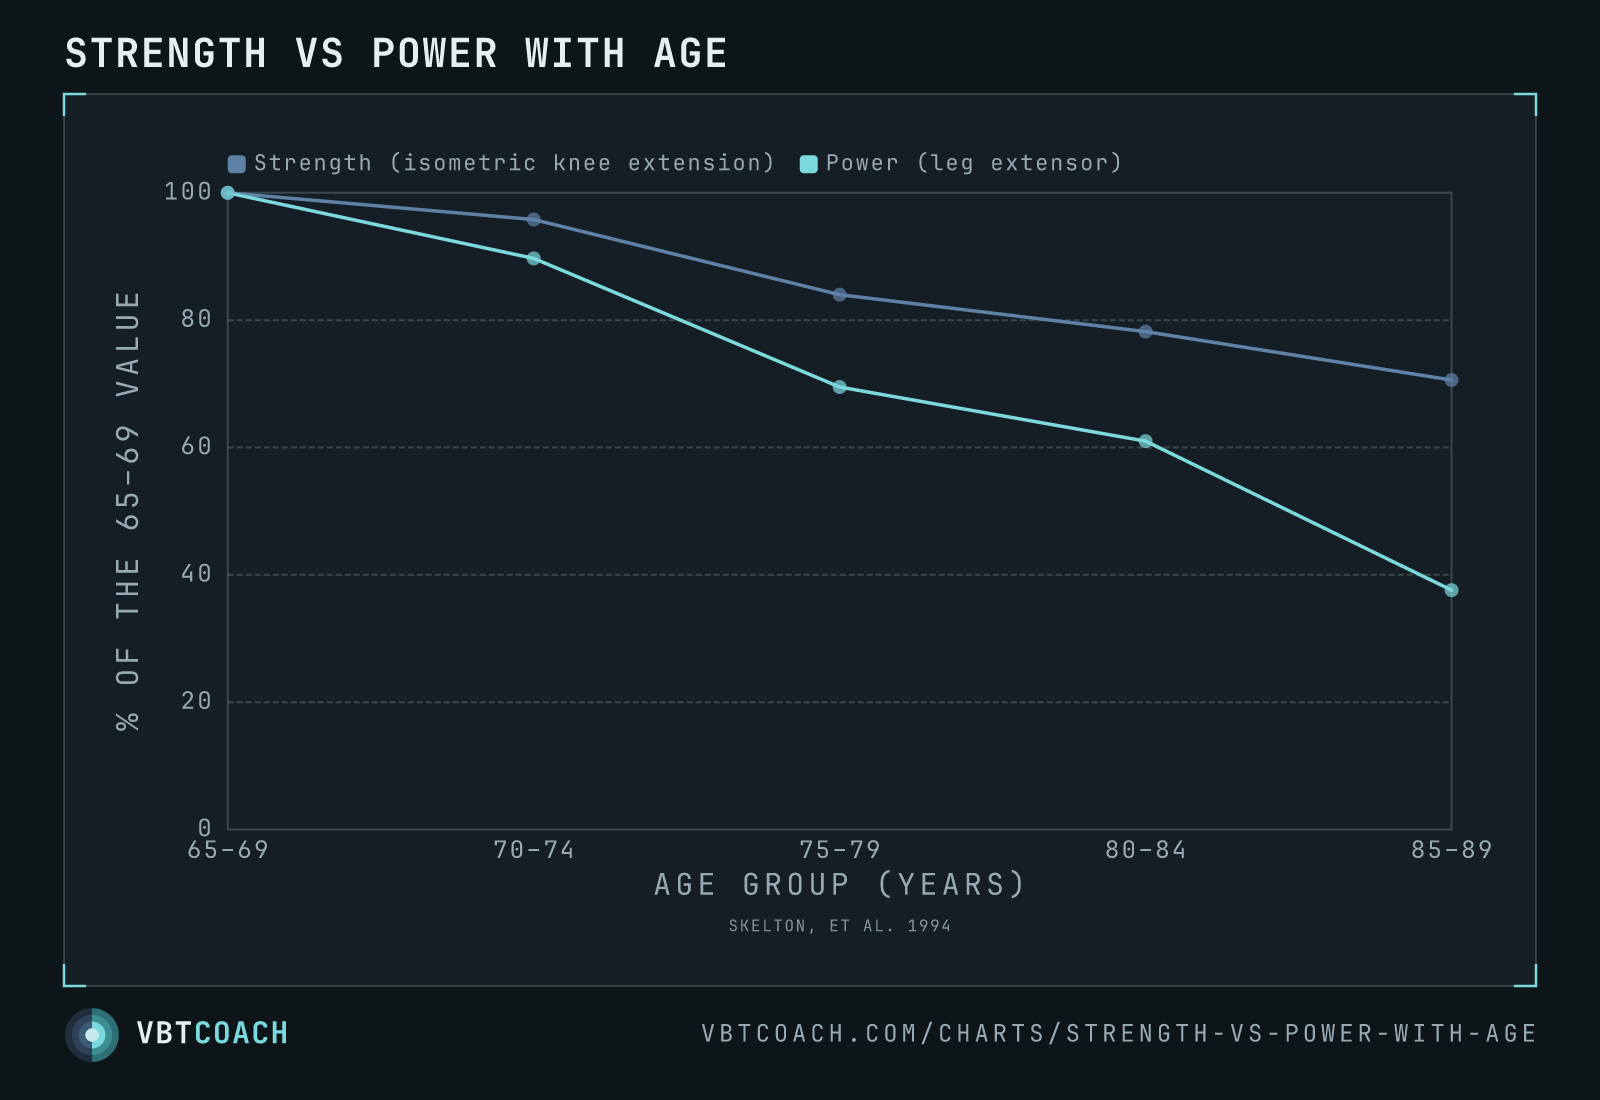
Skelton 1994 — power declines twice as fast as strength with age
Skelton 1994 — 50 healthy men aged 65–89. Across the age bands isometric strength falls to 71 % of the 65–69 value while leg extensor power falls to 38 %. Power declines at roughly double the rate.
One hundred people aged 65–89, screened hard on health criteria — recruited so that what’s being measured is healthy ageing rather than accumulated disease. Ten per five-year band, 50 men and 50 women. This chart plots the men, where the difference between the two curves is statistically established.
How to read this chart
Both measures are indexed to the 65–69 band at 100 %, because the raw units don’t share an axis — strength is newtons of isometric knee extension, power is watts off a leg extensor rig. What matters is the relative rate, and indexing is the only honest way to put the two on one scale.
The lines start together and end nowhere near each other:
| Age band | Strength | Power |
|---|---|---|
| 65–69 | 432 N (100 %) | 213 W (100 %) |
| 70–74 | 414 N (96 %) | 191 W (90 %) |
| 75–79 | 363 N (84 %) | 148 W (69 %) |
| 80–84 | 338 N (78 %) | 130 W (61 %) |
| 85–89 | 305 N (71 %) | 80 W (38 %) |
By the late eighties these men held onto 71 % of their strength and 38 % of their power. The regression slopes say the same thing: −1.8 % a year for strength, −3.7 % for power. Roughly double, and the gap is significant in men (p = 0.0001). In women the same pattern appears but doesn’t reach significance (p = 0.08).
Why this matters more than the strength number
Power is force × velocity. Strength only covers the force half, and the velocity half is what degrades.
That’s not an academic distinction, because the things that go wrong in older age are all fast: catching a stumble, standing up before the bus pulls away, getting a foot out to arrest a fall. None of them are limited by how much force you can eventually produce. They’re limited by how much you can produce right now. In this study power standardised for body weight — not strength — predicted chair-rise time and step height.
So a training programme that only ever chases a heavier 1RM is defending the slower-declining half of the equation.
What this means for training older athletes
- Train the velocity end, not just the load end. Light, fast, intent-driven work is not a warm-up for the real session in this population. It’s the session that targets the thing actually disappearing.
- Measure it. Strength is easy to track and reassuring. Power is the one moving, and if you’re not measuring bar speed you won’t see it go.
- Don’t retire the heavy work either. Force is one of the two terms. It’s just not the urgent one.
This is the clearest argument in the literature for why power deserves its own slot in a programme rather than being treated as a by-product of getting stronger.
Two honest caveats
- This is cross-sectional, not longitudinal. Nobody was followed over time — these are five different groups of ten men, measured once. The paper puts “losses” in scare quotes throughout and so should you. A cohort effect isn’t ruled out by this design.
- The last point is the noisiest. The 85–89 power figure is 80 W with a standard deviation of 49 across ten men. The drop is real and large; it is not as precise as a single plotted point makes it look.
Source: Skelton, D. A., Greig, C. A., Davies, J. M., Young, A. (1994). Strength, Power and Related Functional Ability of Healthy People Aged 65–89 Years. Age and Ageing, 23(5), 371–377.
Download high res chart images
High-resolution PNG, 1600×1000, watermarked. Free to share, embed in slides, or print. Credit appreciated.