Supercompensation chart
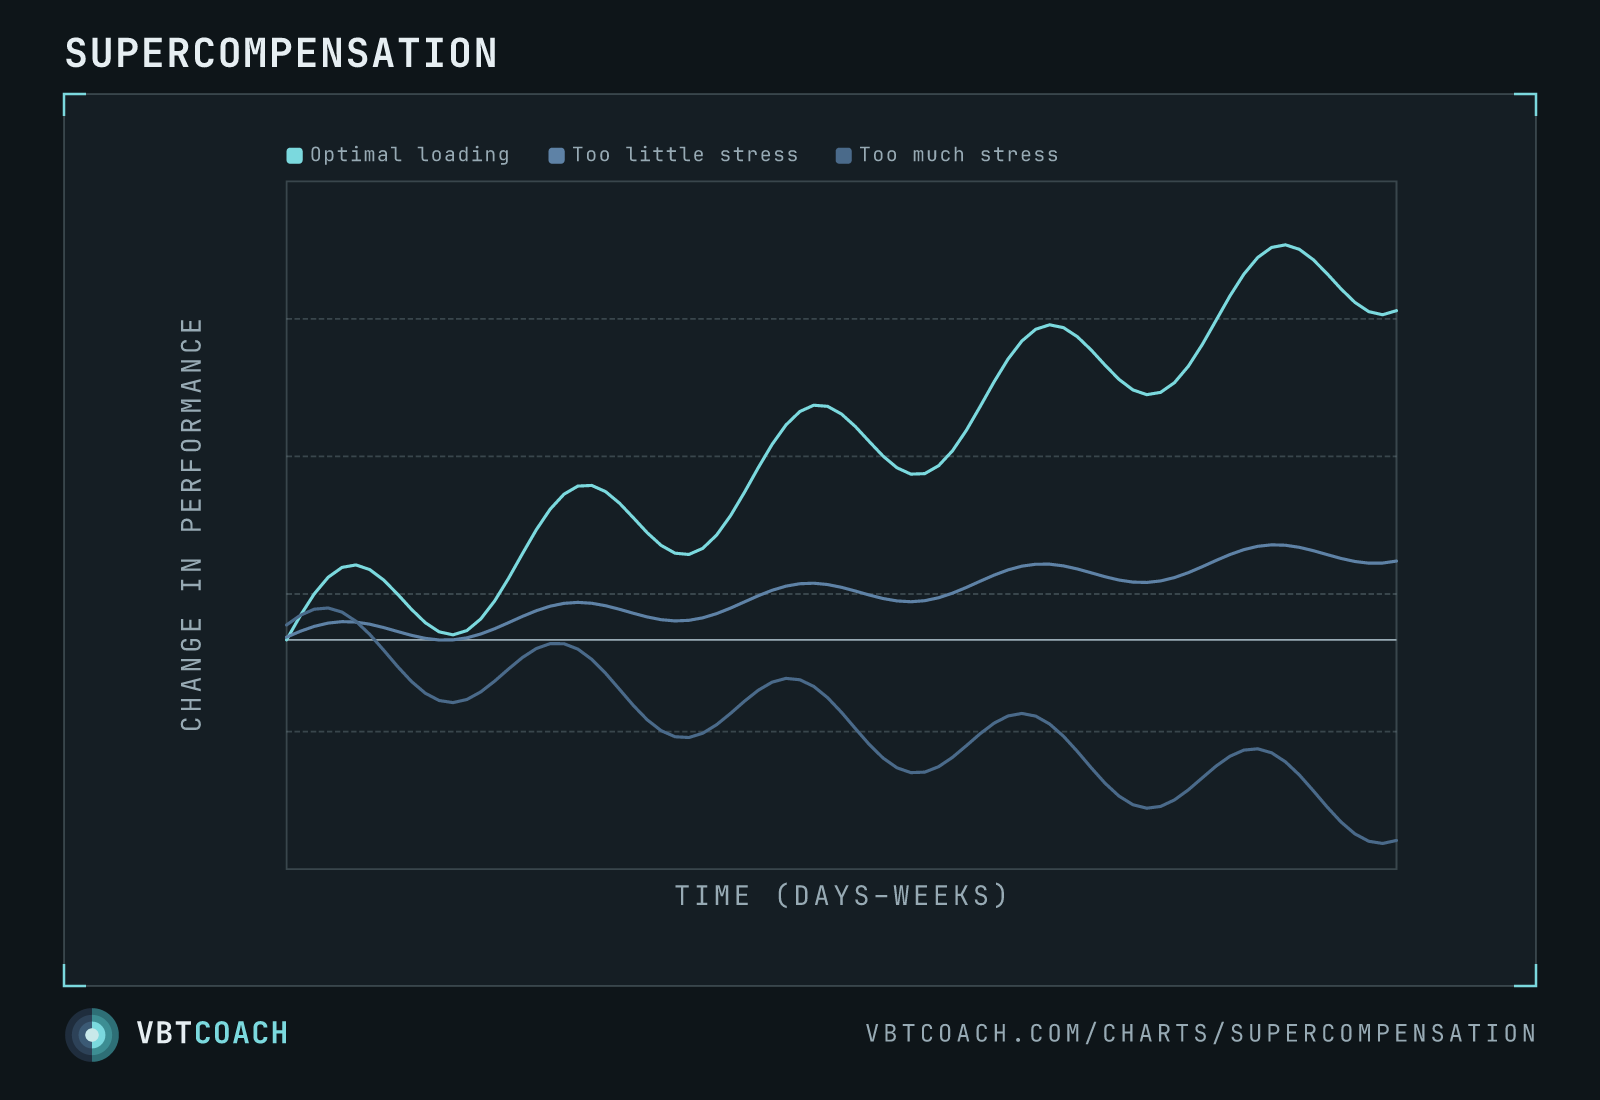
Three training-load trajectories on a "change in performance vs time" axis. Optimal loading climbs in waves, too little stress plateaus, too much stress regresses. The classic adaptation curve.
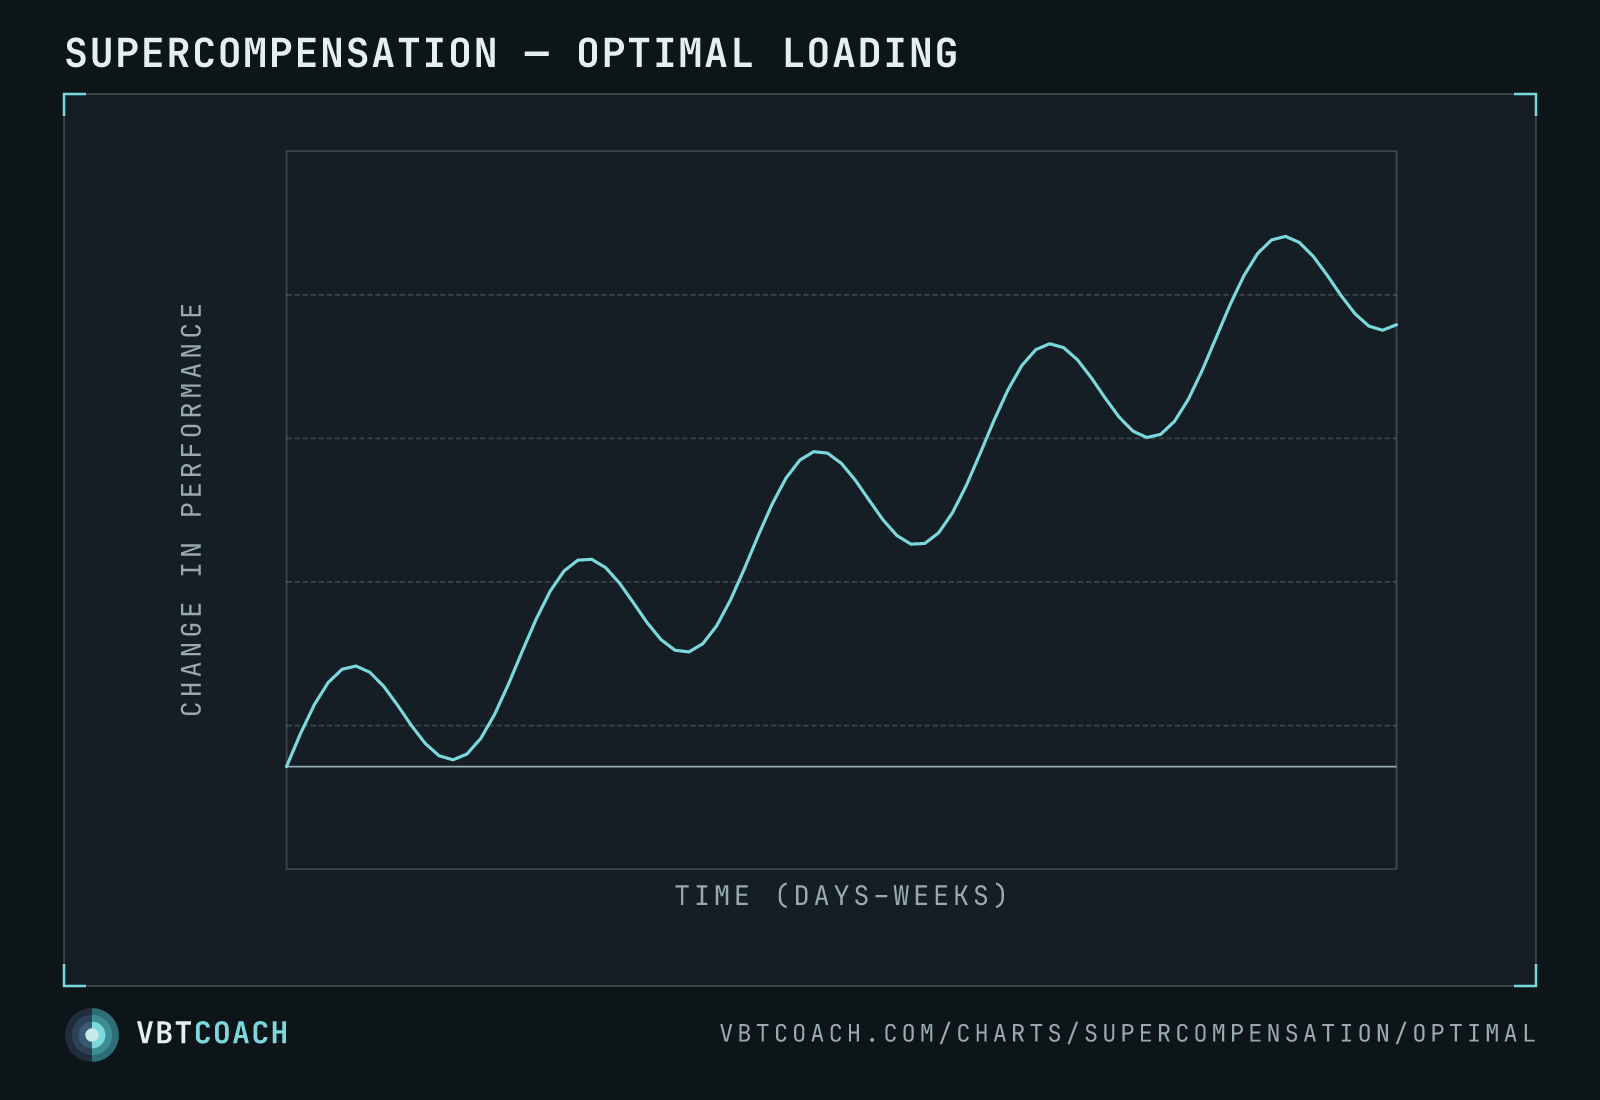
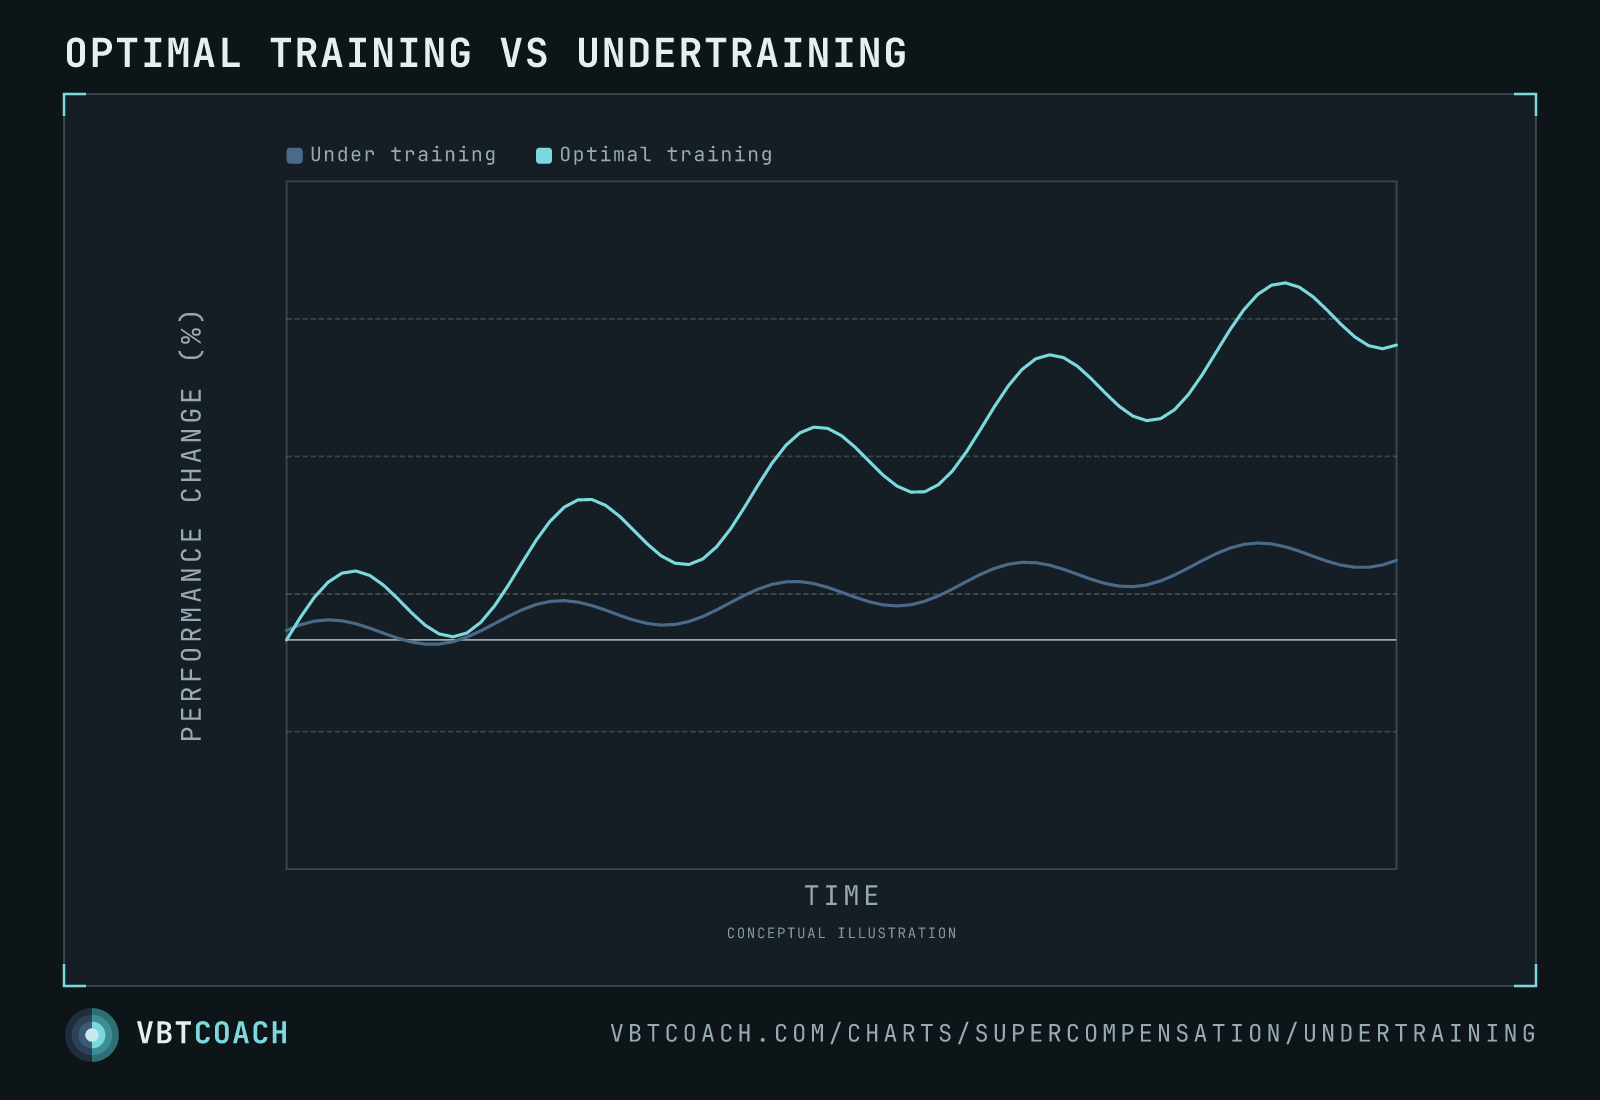
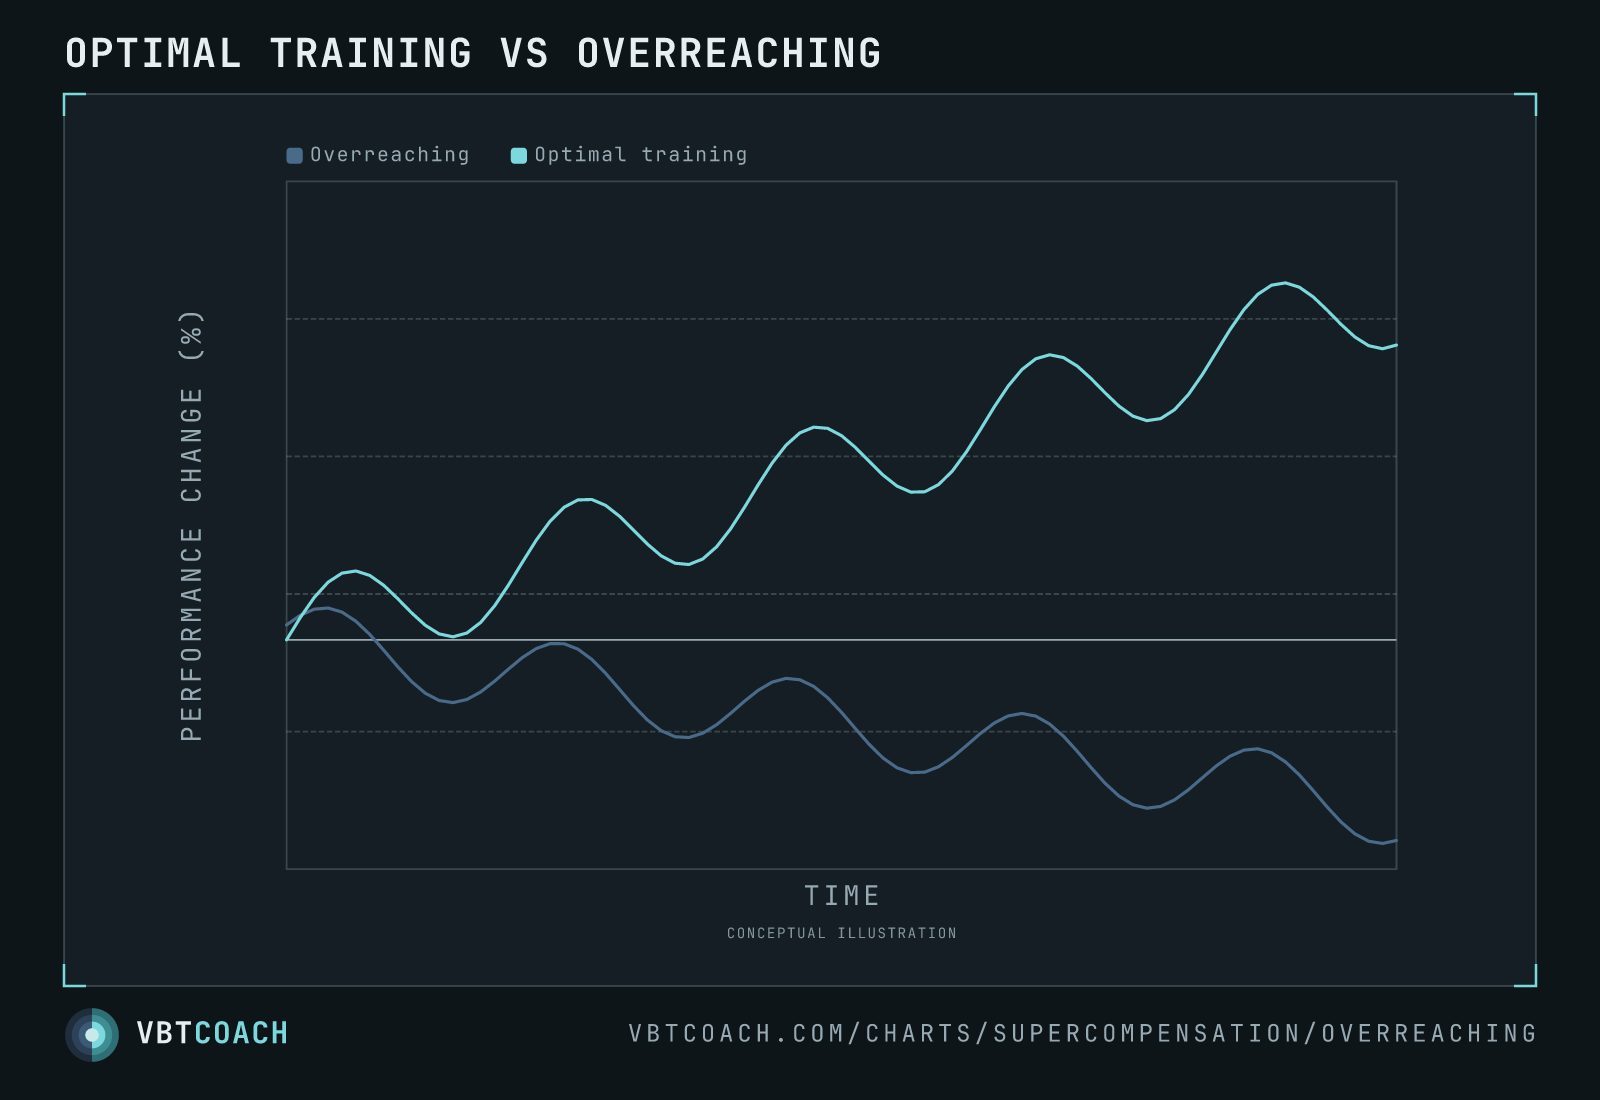
The supercompensation model: each training session creates a short-term performance dip followed by recovery to a slightly-higher baseline. Stack sessions at the right cadence and the baseline climbs over weeks (optimal). Train too sparingly and the baseline drifts sideways (too little stress). Train too frequently or too hard and the recovery never completes, so each successive session starts from a lower baseline (too much stress).
All three trajectories oscillate with the same short-term frequency — the within-session fatigue → recovery cycle. What differs is the trend underneath: the slope of the long-run line through the wiggles. That’s where the regime divergence lives, and it’s almost always invisible day to day. You have to zoom out to a multi-week window to see it.
Download high res chart images
Every chart on this page as a high-resolution PNG — 4 exports, 1600×1000, watermarked. Free to share, embed in slides, or print. Credit appreciated.