Zourdos 2016 — 1RM fluctuates ±3–5% day-to-day in trained lifters
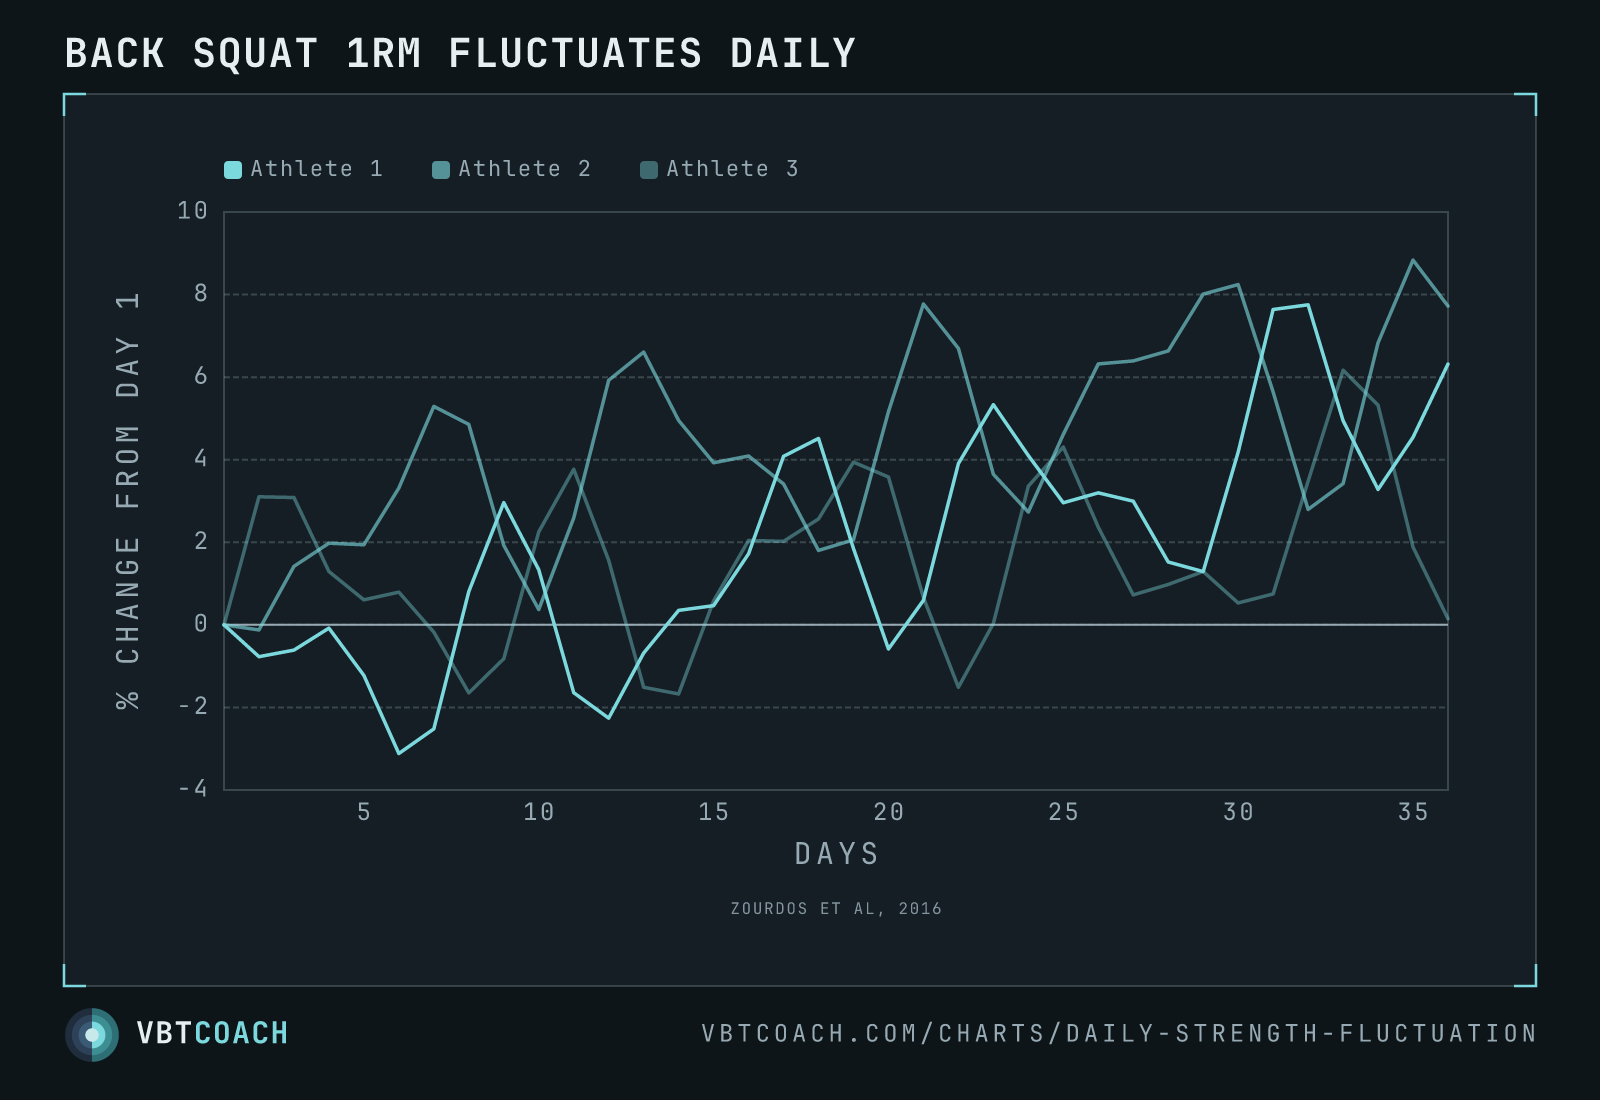
Zourdos 2016 — three trained powerlifters tested daily for 36 days. Day-to-day variation runs ± 3-5 % from the previous day's reading, even with no programmed change in load.
Zourdos and colleagues ran a 36-day case series on three trained powerlifters / weightlifters, testing 1RM strength daily. The point of the study isn’t the long-run trend (though all three athletes did get stronger over the month). The point is the noise — daily 1RM readings swing ± 3–5 % from one day to the next, even with no change in programmed load. That noise is precisely why fixed-percentage prescription mis-loads the bar most days.
How to read this chart
X-axis is days, 1 to 36. Y-axis is percentage change in 1RM relative to day 1. Each line is one athlete, all anchored at 0 % on day 1. The teal line ends highest (+9 %), the navy line in the middle (+5 %), and the deep navy line lowest (~+3 %) — but the long-term ranking matters less than the shape of each line.
Look at any single line and trace day-to-day. The local jaggedness — the ± 3–5 % swings between adjacent days — is the practical takeaway. When yesterday read 5 % above day 1 and today reads 0 %, the athlete didn’t get weaker; they’re just inside the normal noise band of daily readiness.
When to use this evidence
- Defending auto-regulation. A program that prescribes “85 % 1RM” five days in a row treats day-to-day fluctuation as zero. The chart shows it isn’t. Daily readiness drifts.
- Justifying VBT to a sceptical lifter. If 1RM swings by 3-5 % each day, your “85 % 1RM” target load is off by ± 5 % most sessions. Reading bar speed corrects that mis-load in real time.
- Coaching mental framing. A bad lifting day isn’t a regression. It’s the normal bottom of the daily-readiness wave. The next session is likely to bounce back.
Why daily 1RM moves so much
Strength on any single day reflects the integrated state of the whole system: sleep, hydration, glycogen, central-nervous-system fatigue, mood, hormonal cycles, even ambient temperature. Each of those moves on its own clock. The combined effect averages out over weeks, but on a single morning it can produce ± 5 % variation in true working capacity. Programs that don’t account for it are betting against the noise.
Pitfalls
- Three athletes isn’t a meta-analysis. This is a case series, not a controlled trial. The qualitative pattern (high day-to-day noise) is robust across the broader literature; the specific magnitudes vary.
- The trend line matters. All three athletes climbed over 36 days — the noise is overlaid on actual strength gain. Don’t read the noise as proof that training doesn’t work.
- Daily 1RM is brutal. This study was a research protocol; you wouldn’t program daily max attempts in real training. The principle generalises to working loads that are near daily max — they fluctuate too.
Where to go next
For the practical “how to auto-regulate against daily readiness” guide, see Readiness and autoregulation with VBT. The Load–velocity profile chart and its interactive generator are the primary tools for catching daily fluctuation in working sets.
Download high res chart images
High-resolution PNG, 1600×1000, watermarked. Free to share, embed in slides, or print. Credit appreciated.