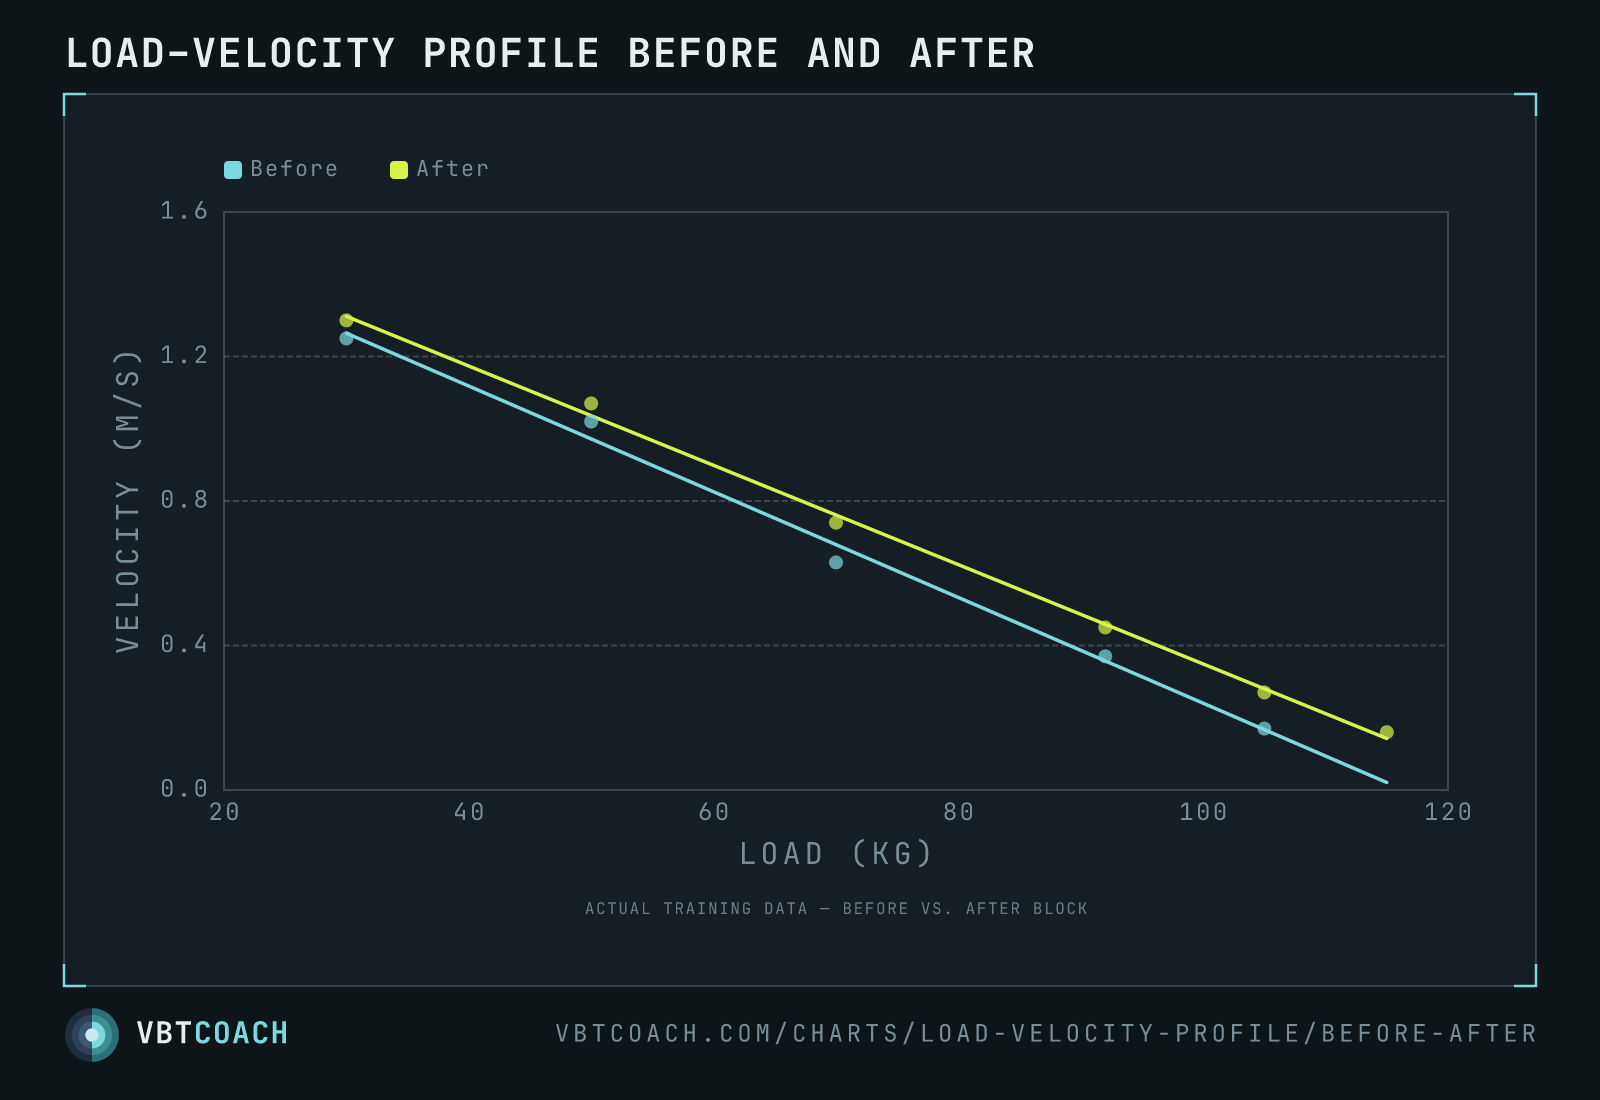
Load–velocity profile chart
The load-vs-speed function for a given lift and athlete. Plot a few sub-maximal sets and you can read 1RM from the line, compare lifts side-by-side, and see why a single percentage of 1RM lands different athletes in different velocity zones.
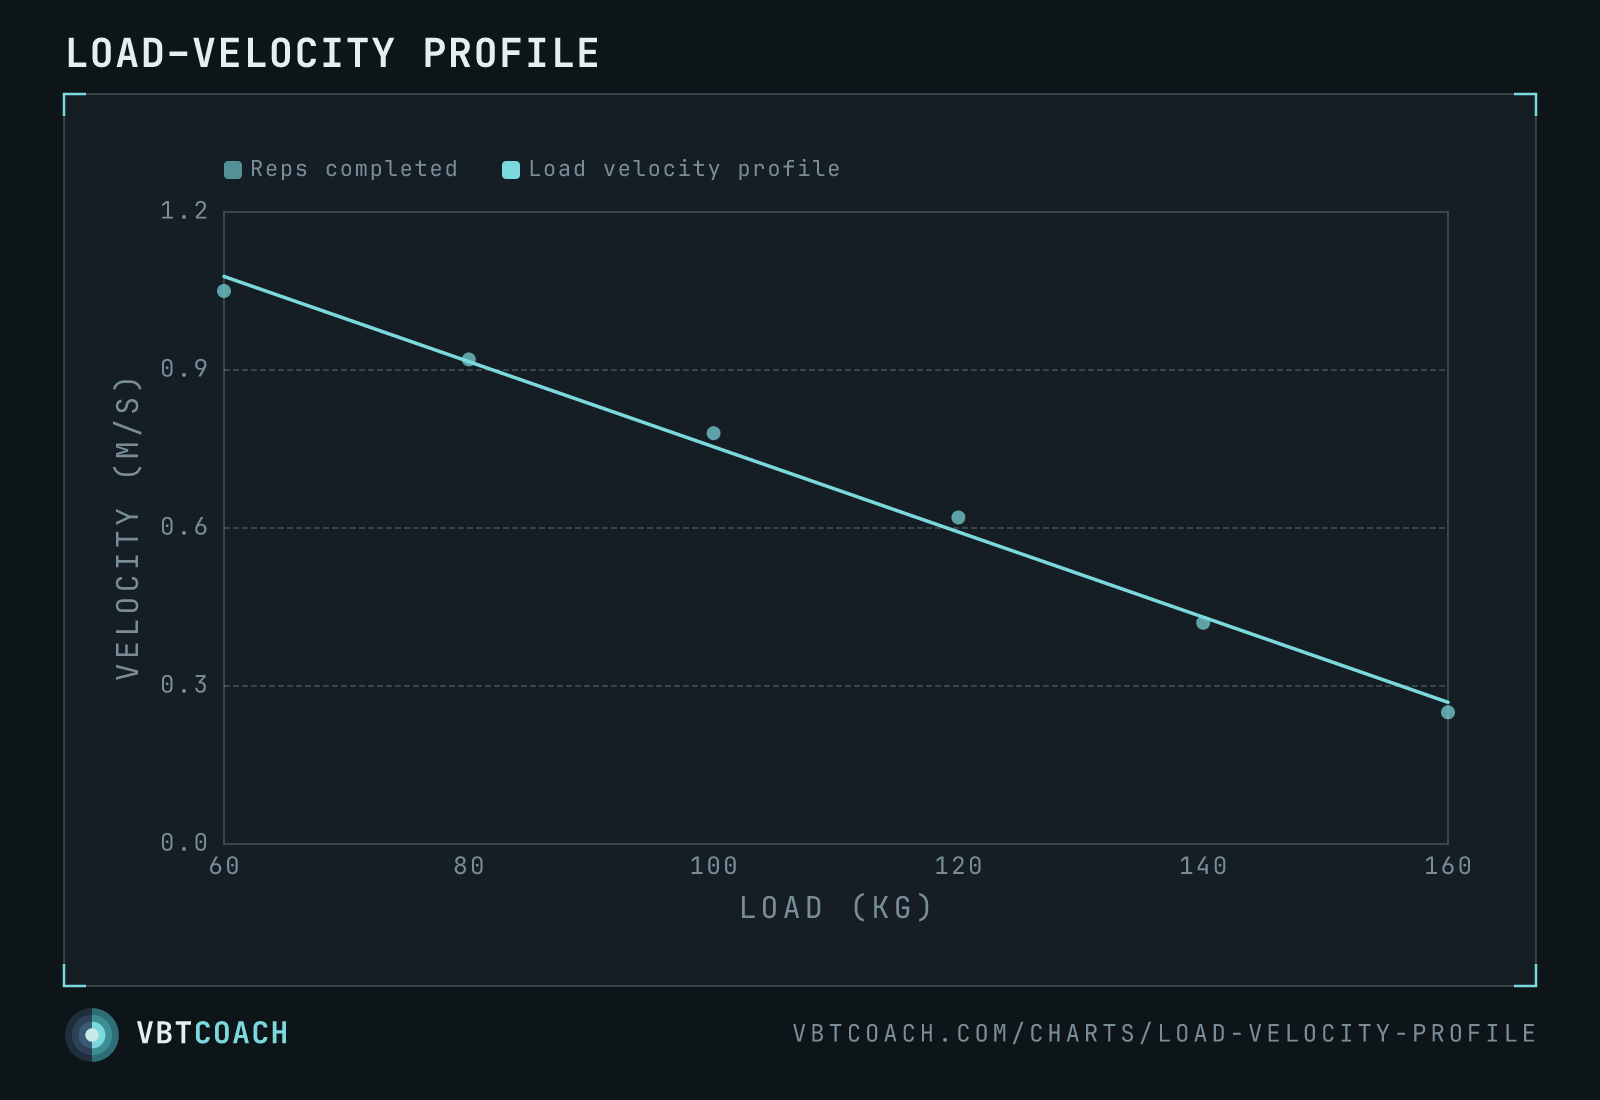
The load–velocity profile is the load-vs-speed function for a given lift and athlete. It’s near-linear inside the loads we care about, which is what makes it useful: a few sub-maximal sets give you the slope, the slope tells you what an athlete can grind out at minimum velocity threshold, and minimum velocity threshold ≈ 1RM.
How to read this chart
X-axis is load in kilograms. Y-axis is mean concentric velocity. Each point is one set’s representative rep — the fastest concentric, or the average across reps in a small cluster. The line through them is the regression. The dashed reference line at MVT (~0.25 m/s for squat, ~0.20 m/s for bench, ~0.15 m/s for deadlift) marks where the line predicts a 1RM. Where the regression line crosses MVT is the estimated max.
Steeper slope = lift drops velocity faster as load climbs, characteristic of less-trained or less-strength-biased athletes. Flatter slope = athlete maintains speed deeper into the load range, the hallmark of advanced strength athletes.
When to use it
- Estimating 1RM without maxing. Pull two or three sub-maximal sets at 60–90 % of estimated max, plot, intersect with MVT, read off the predicted 1RM. Cleaner than working up under fatigue.
- Programming across cycles. Re-profile every 4–6 weeks. The slope tells you how loads need to climb to keep relative intensity constant — flatter slope week-on-week means the athlete got faster at the same loads (i.e. stronger).
- Detecting technique drift. A single rep that falls off the regression line is usually a coaching cue, not bad data. Investigate the rep before discarding the point.
- Catching readiness changes. Same loads, slower velocities → undertrained, overreached, sick, or sleep-deprived. The profile shifts down before lifters report feeling off.
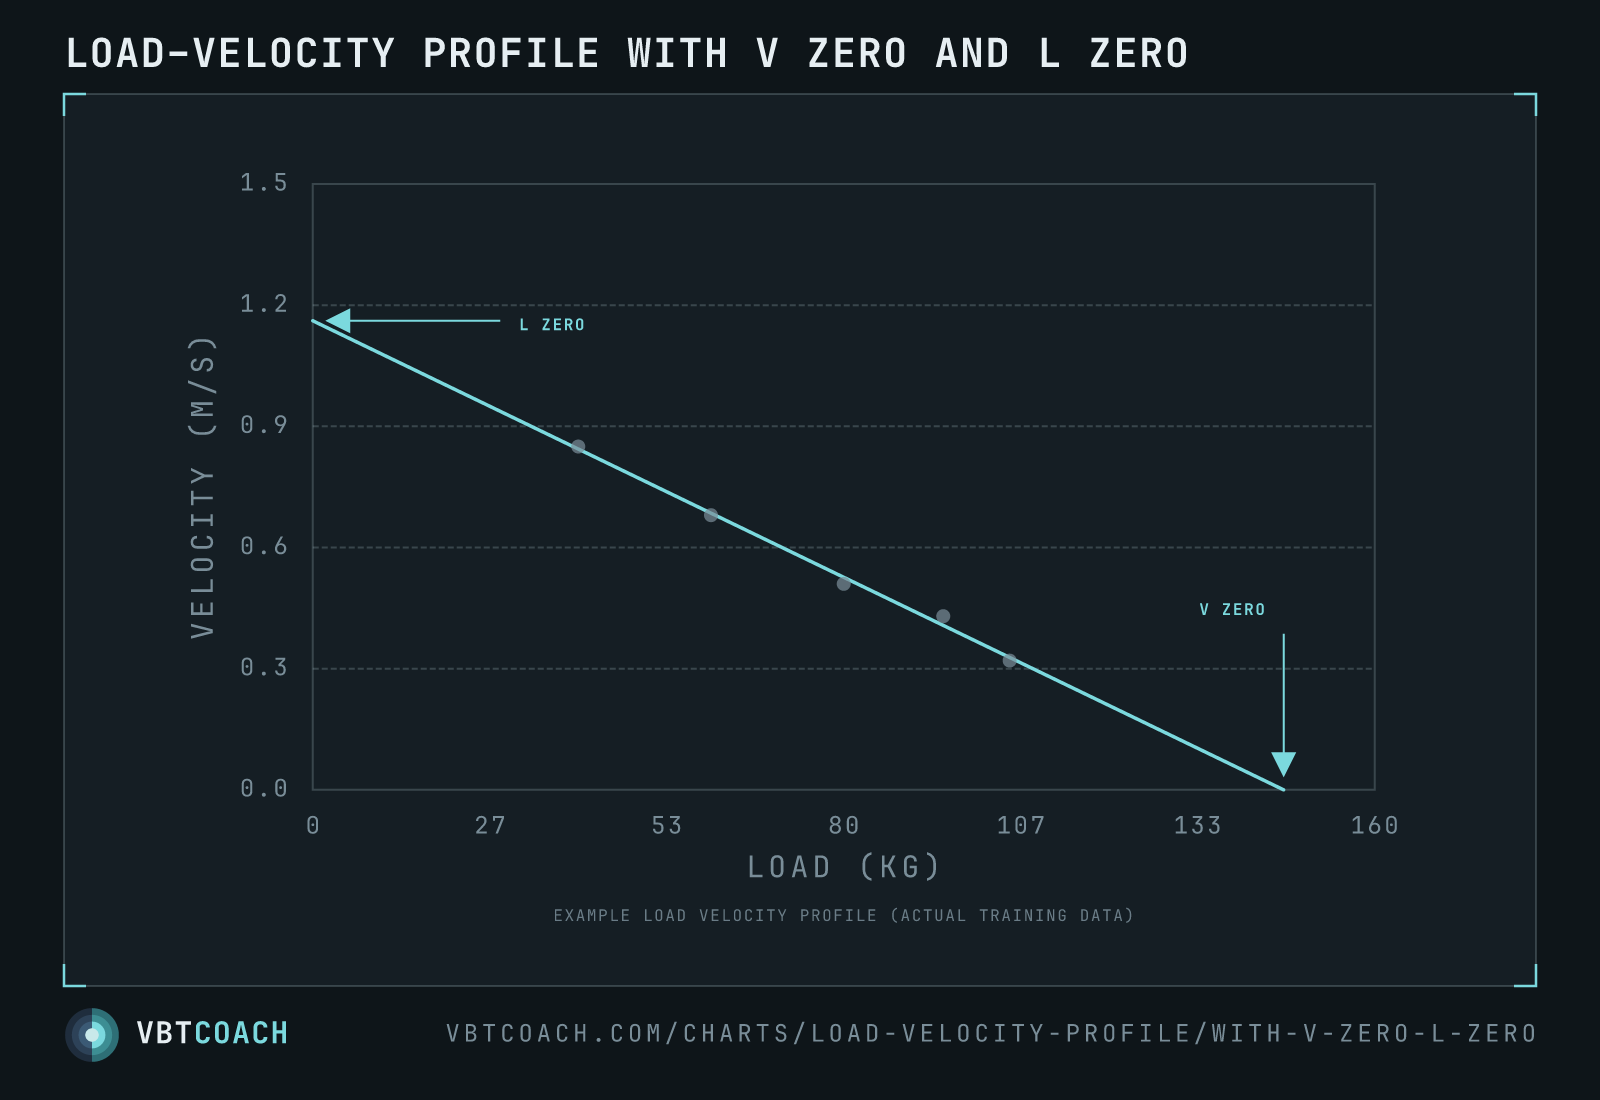
Reading e1RM off the line
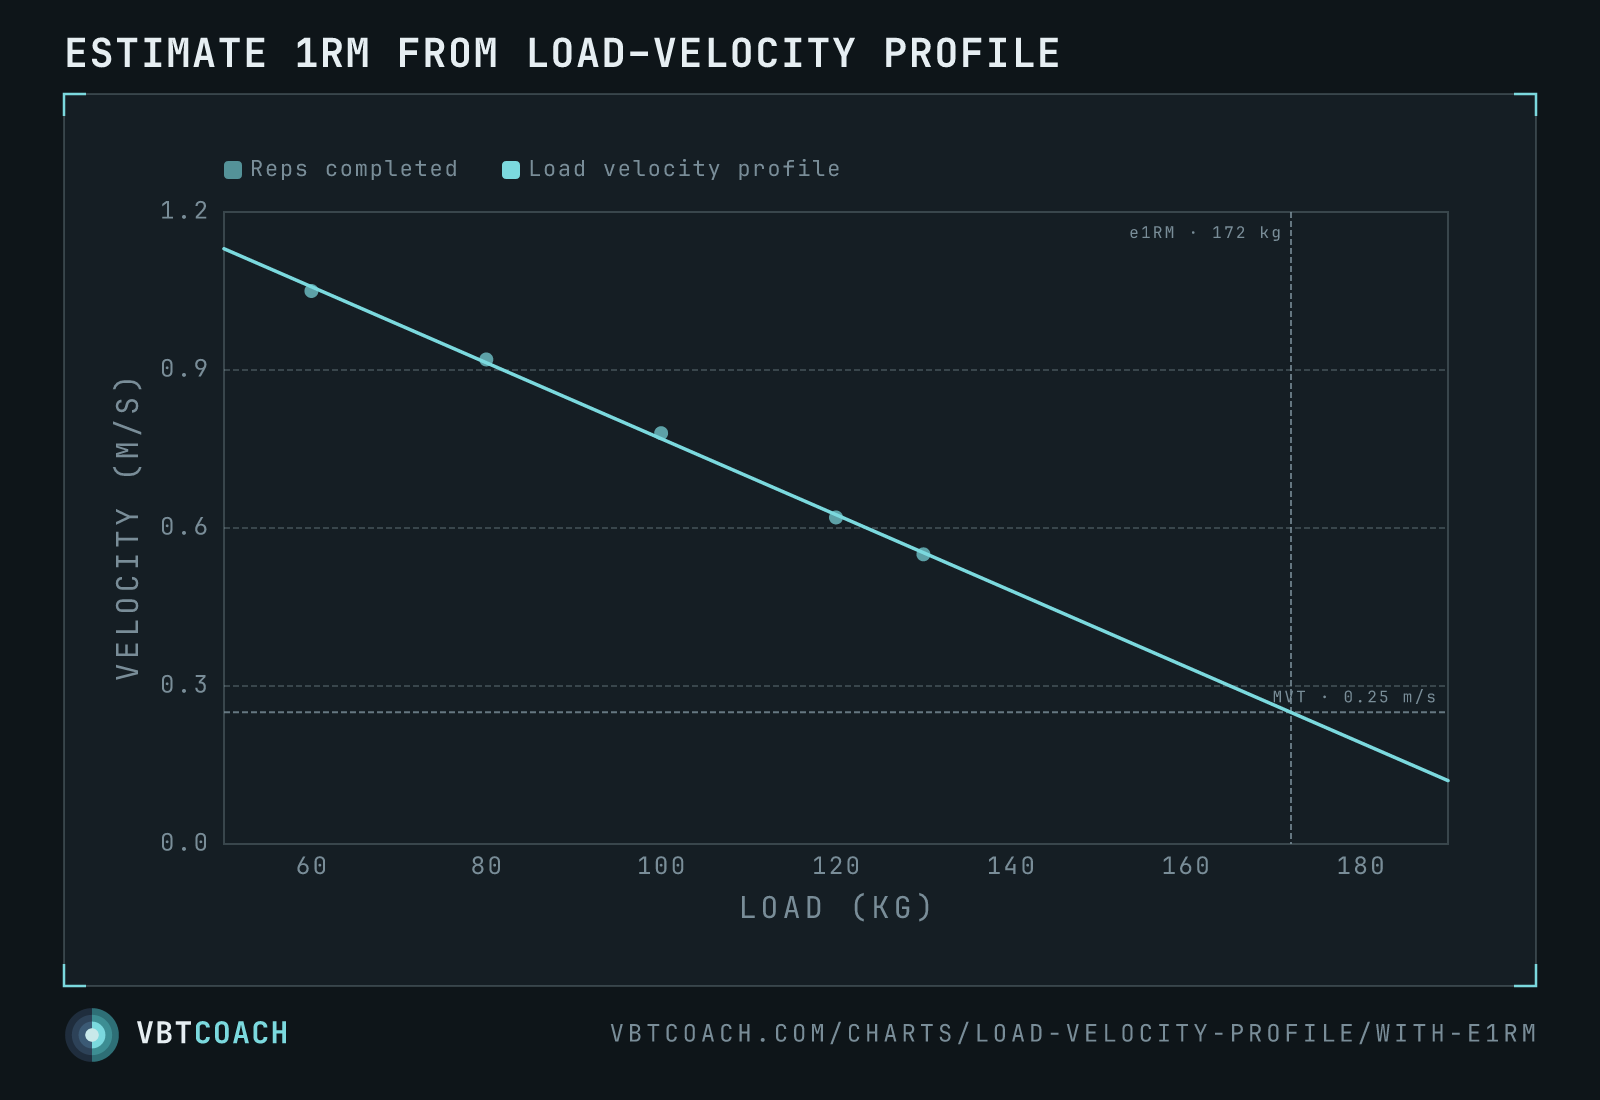
The regression line keeps going past your highest measured load. Extend it to the minimum velocity threshold for the lift and read off where they meet — that load is the estimated 1RM:
The signal-lime dots are the actual sub-maximal sets you performed. The teal line is the linear best fit through those dots. The horizontal dashed line marks MVT (here 0.25 m/s — the squat’s typical 1RM bar speed). The vertical dashed line marks the e1RM — the load at which the regression line crosses MVT. In this example, four working sets up to 130 kg predict an e1RM around 172 kg, no max attempt required.
A few notes on the technique:
- Outliers don’t hijack the prediction. The line is a least-squares best fit, not a connect-the-dots polyline. A single noisy point shifts the prediction by a small amount.
- Three points minimum, five is comfortable. Beyond that, returns diminish. Quality of points (clean reps, fresh, no technique drift) matters more than count.
- Reliable inside ~10 % of your highest observed load. A regression built from 60–80 % loads will predict a 1RM well. Built from 30–50 %, it’ll over-shoot.
Different lifts, different profiles
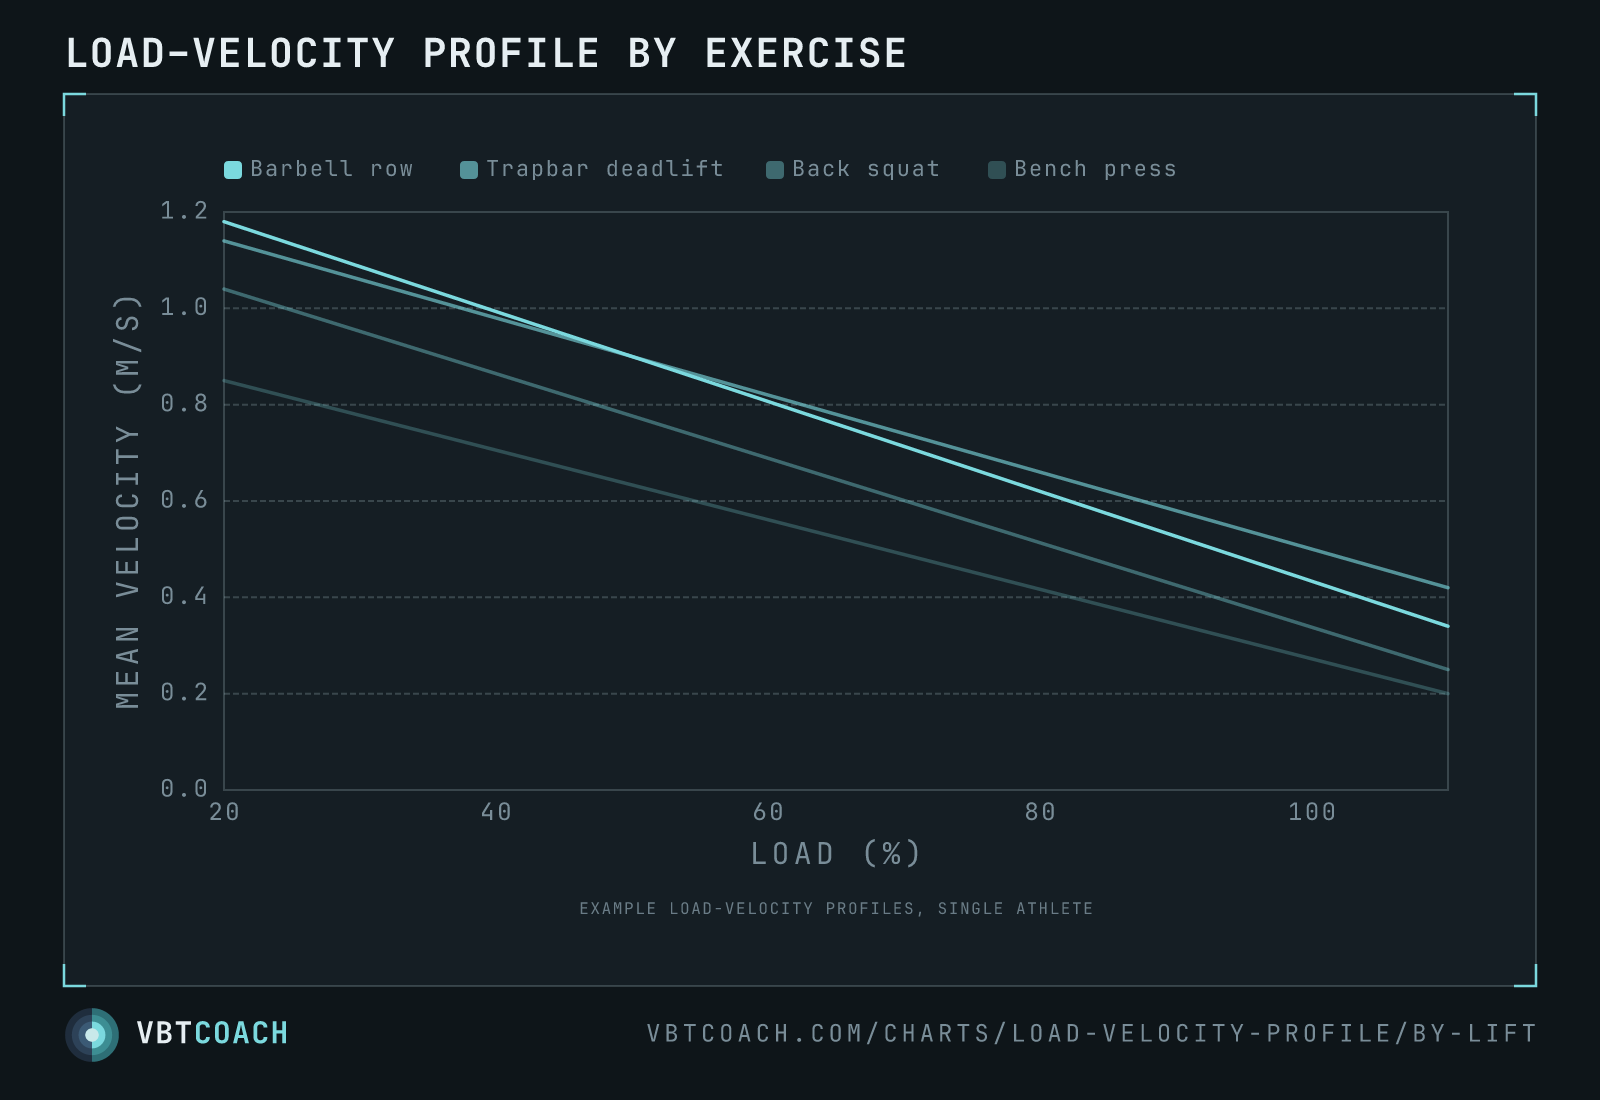
The profile is lift-specific. Same athlete, same testing window, four compound lifts — and four meaningfully different lines:
- Barbell row — highest intercept (~1.18 m/s at 20 % load), shallow slope; the body is in a relatively short ROM with the bar finishing fast.
- Trapbar deadlift — similar high intercept (~1.14 m/s), slightly steeper slope; faster than a conventional deadlift because the load sits closer to the centre of mass.
- Back squat — middle of the pack at light loads, steep slope dropping toward ~0.25 m/s at 1RM.
- Bench press — lowest intercept (~0.85 m/s), steepest relative slope; bench MVT is close to 0.15 m/s for trained lifters.
Each lift’s profile is shaped by the same load-vs-velocity physics but mediated by lift-specific mechanics — ROM and leverage, stability cost, sticking-point shape. The practical implication is straightforward: don’t borrow one lift’s profile to predict another. A 0.80 m/s working set is heavy bench (~ 30 % 1RM) but light squat (~ 60 % 1RM). The companion MVT by lift table gives the right intercept value to use for each lift when extrapolating to 1RM.
Same percentage, different velocity zones
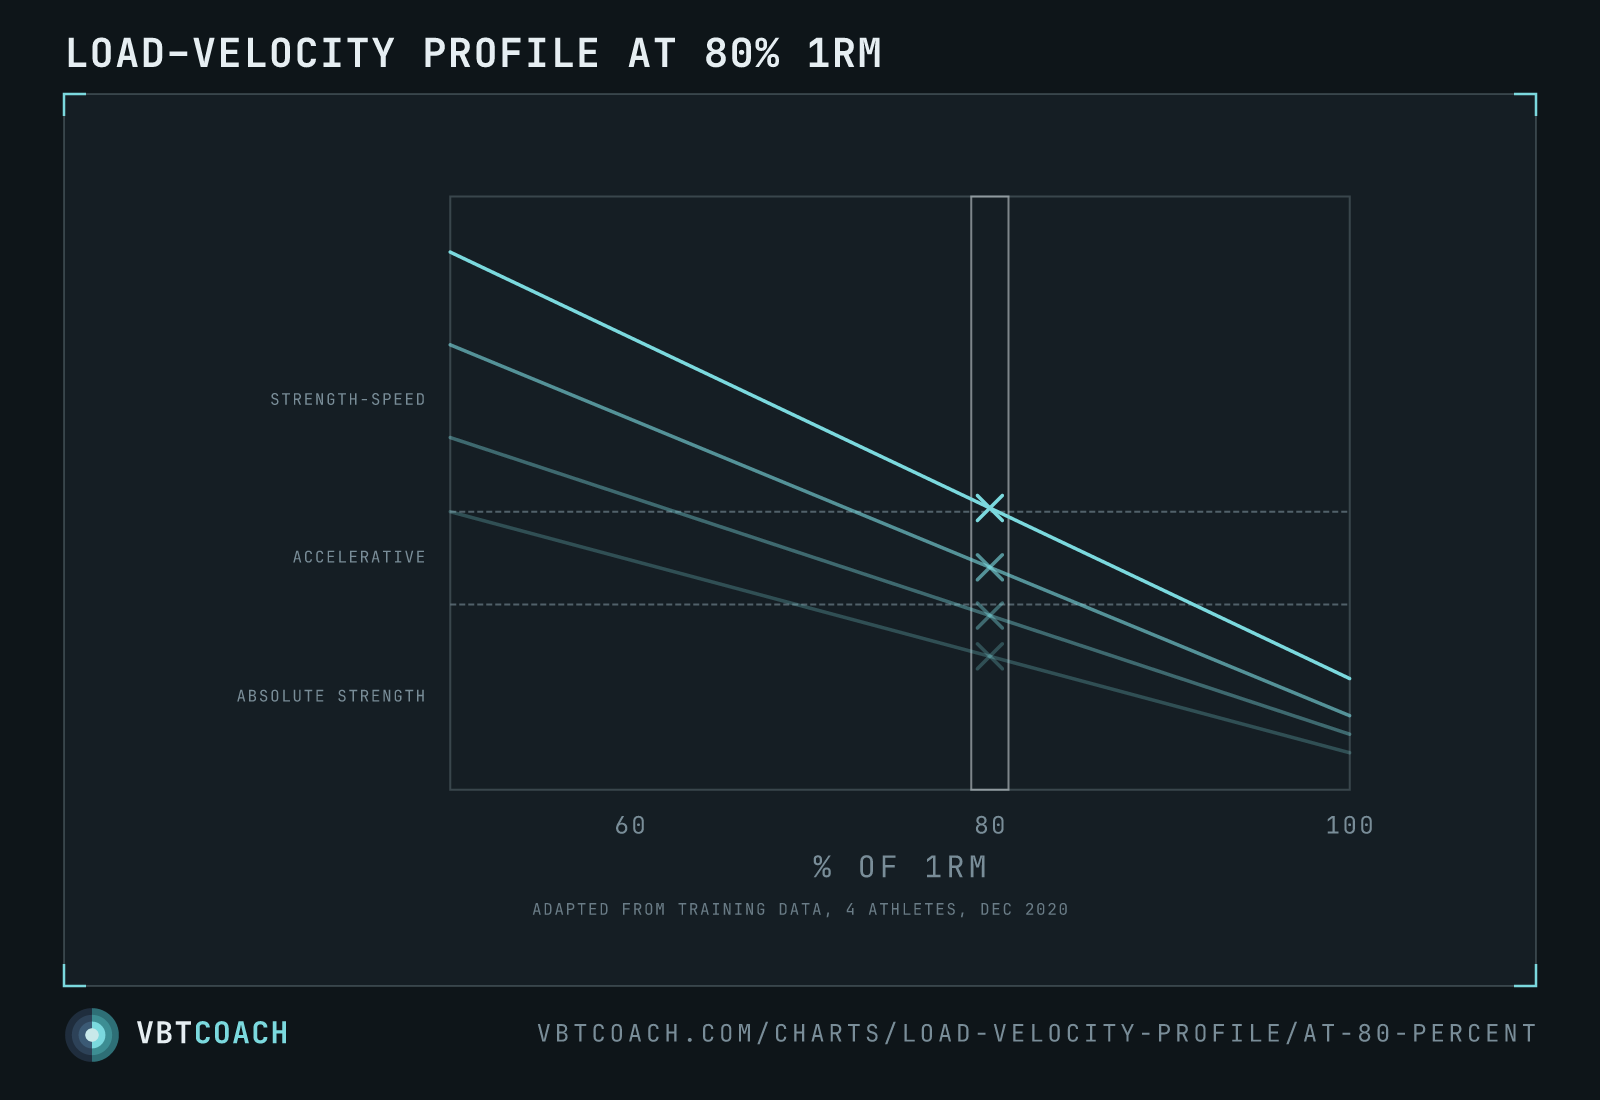
The profile is also athlete-specific. Each athlete’s slope and intercept differ enough that the same percentage of 1RM lands different lifters in different velocity zones:
Four athletes, all working at 80 % 1RM on the same lift. Reading down the highlighted column: athlete 1 at ~0.79 m/s (strength-speed), athlete 2 at ~0.60 m/s (accelerative), athlete 3 at ~0.47 m/s (absolute), athlete 4 at ~0.35 m/s (absolute). Three of the five Mann velocity zones, same prescription on the program sheet.
This is the cleanest visual case for individual profiling against group programming. A team-sport coach prescribing “80 % 1RM for everyone” is asking some athletes for strength-speed work and others for absolute-strength work in the same set. The training stimulus diverges even when the program sheet says one number — and a stuck lifter often isn’t responding to the program as written because their personal profile sits in a different zone than the program assumes.
Why the spread exists across the population
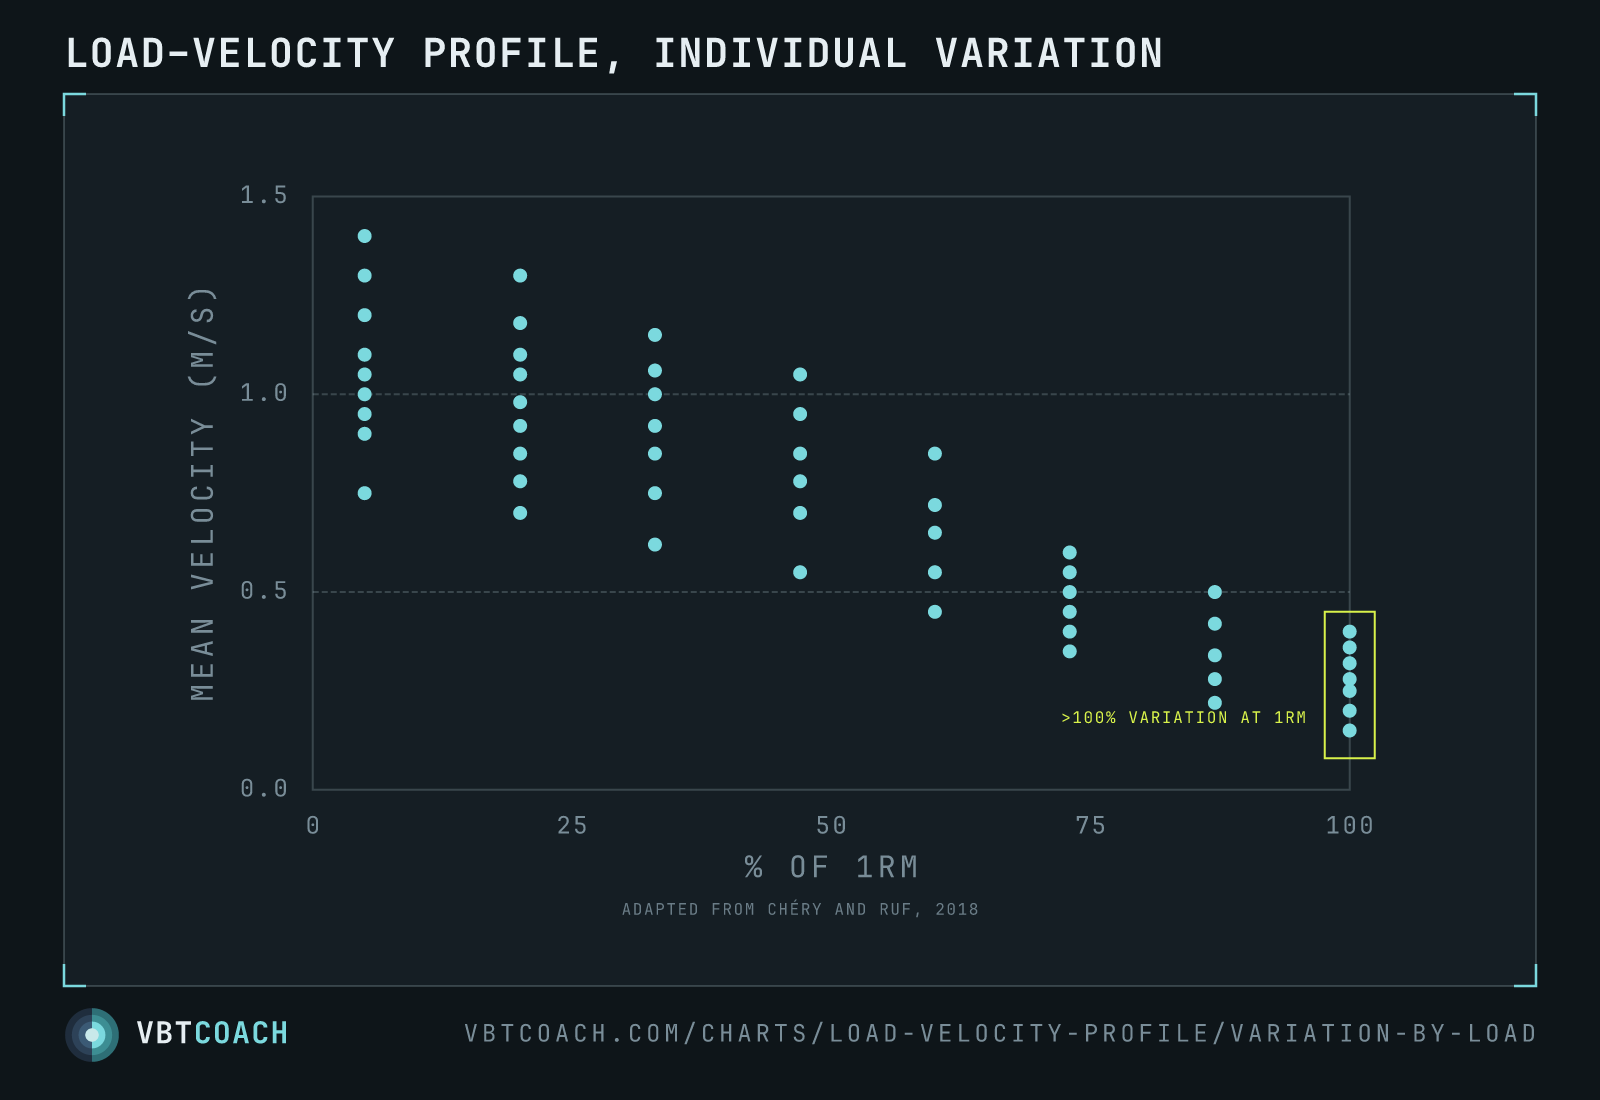
Zoom out from four athletes to a published cohort and the pattern holds — velocity at any given % 1RM scatters by tens of cm/s:
Chéry and Ruf 2018 plotted measured mean concentric velocity at eight load percentages. The result is not a tight curve — it’s a vertical spread at each load, widest in percentage terms at the heavy end. At 100 % 1RM, individual velocities range from below 0.20 m/s to above 0.40 m/s, more than 100 % variation across the midpoint of that cluster.
Several factors stack: genuine individual differences (strength-biased lifters are slower at the same percentage; speed-biased lifters are faster), day-to-day readiness (the same athlete tested on Monday vs Friday produces different velocities at the same load — see daily 1RM fluctuation), lift-specific differences, and measurement noise. The scatter is wide, but the trend is unmistakable. A 20 % 1RM rep is faster than an 80 % 1RM rep almost without exception. Velocity tracks load — just not perfectly enough to be looked up from a table.
Where the line breaks down
For most lifters, the line stays linear from ~30 % 1RM up to ~90 %. Below 30 % the velocity ceiling caps out (you can only move an empty bar so fast); above 90 % small load changes have outsized velocity costs and the relationship gets noisier. Body-position lifts (clean, snatch) follow a different curve entirely and shouldn’t be modelled as straight lines.
Pitfalls
- Fatigued points pull the slope down. Profile when fresh. Don’t include the back-off set after a heavy single.
- Non-representative reps. A breakdown rep, a missed groove, or an over-cued rep distorts the line. One bad point swings the predicted 1RM by more than you’d think.
- MVT isn’t universal. Treat textbook MVT values as starting points, not constants — confirm yours by capturing the velocity on a true 1RM attempt at least once per training year.
- Don’t extrapolate too far. Reliable predictions sit within ~10 % of your highest observed load. The line is honest about its data range; respect it.
- Stale profiles drift. Some of the population scatter you saw above is the same athlete on different days. Re-profile every 4–6 weeks.
Where to go next
For the full conceptual primer, see our Load–velocity profiling guide. For the practical protocol — how many sets, what loads, how to fit the regression — read 1RM and velocity-based training (VBT): a complete guide and How to create an athletic profile with VBT. To plug in your own data and get an e1RM directly, the Load–velocity profile generator is the interactive version. For how the linear LV profile relates to the theoretical force–velocity curve, see LV profile vs FV curve.
Download high res chart images
Every chart on this page as a high-resolution PNG — 9 exports, 1600×1000, watermarked. Free to share, embed in slides, or print. Credit appreciated.