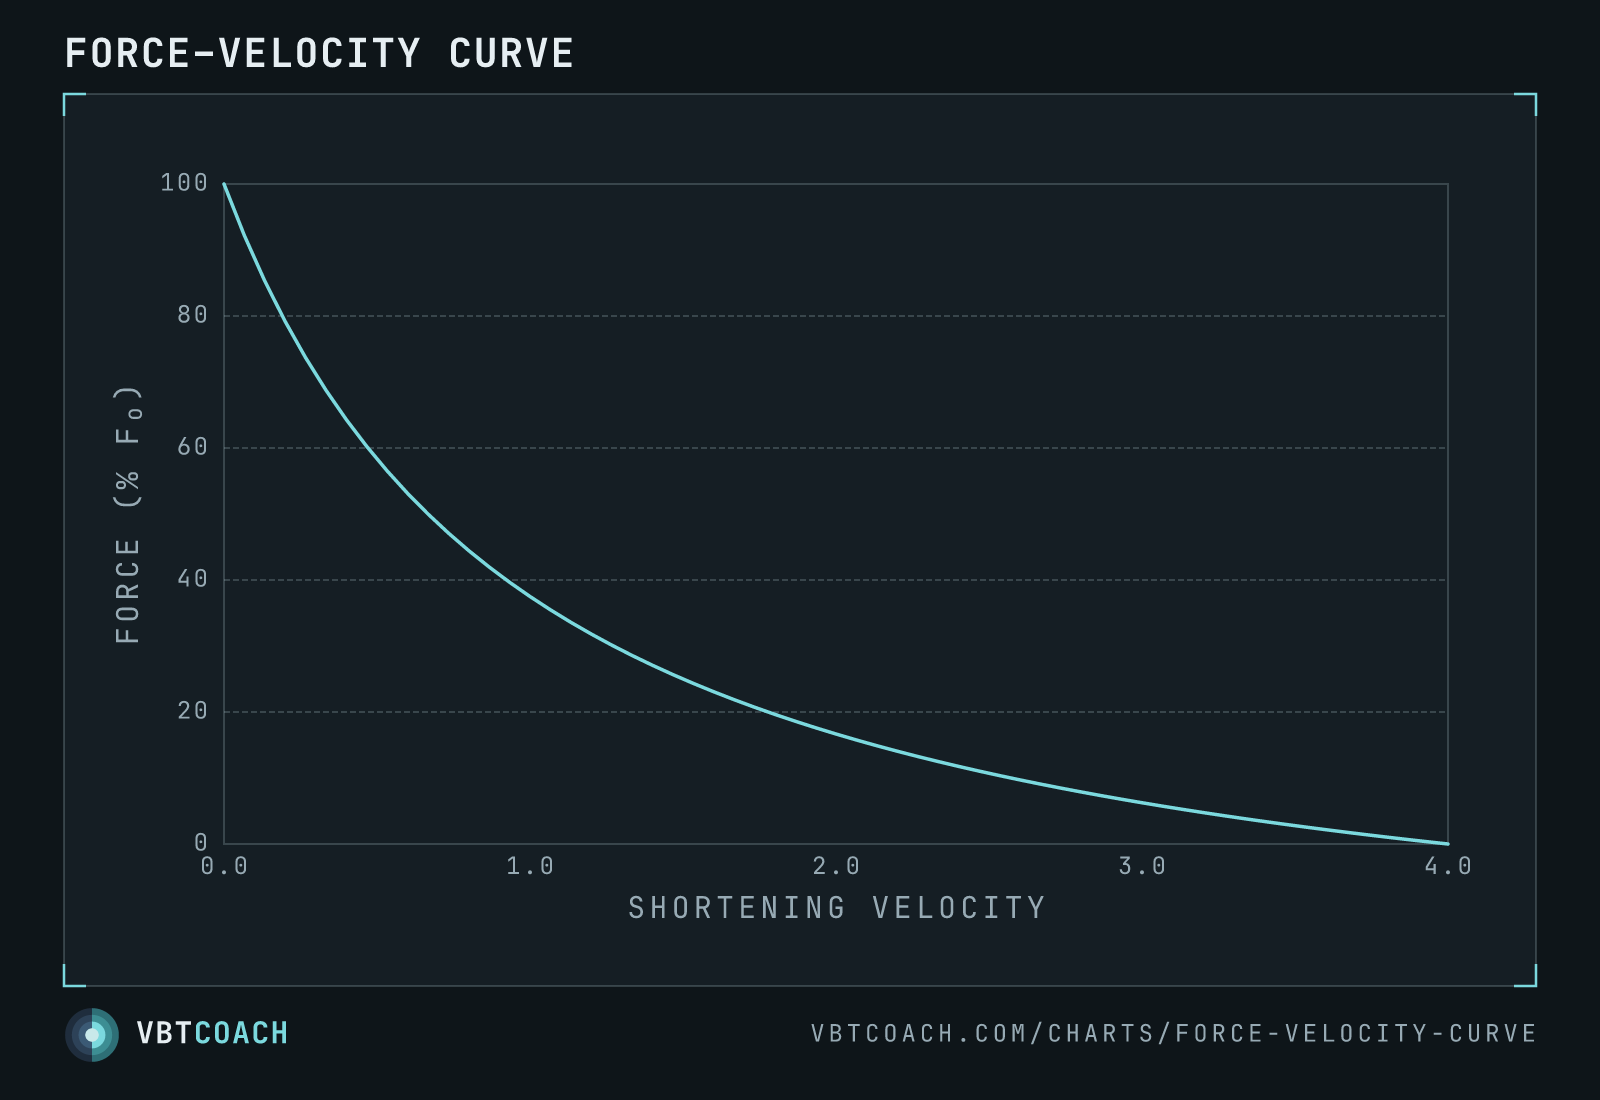
Force–velocity curve — the theoretical relationship between muscle force and shortening velocity
The hyperbolic relationship between contractile force and shortening velocity. Theoretical, derived from isolated-muscle physiology — distinct from the load–velocity profile.
The force–velocity curve is the relationship between how hard a muscle can push and how fast it shortens. It’s hyperbolic: peak force at zero velocity (isometric), peak velocity at zero force (unloaded), and peak mechanical power somewhere in the middle. Hill’s 1938 equation describes the shape — every textbook version you’ve seen is a parameterisation of it.
How to read this chart
X-axis is shortening velocity, normalised to V₀ (the no-load shortening speed). Y-axis is force, as a percentage of F₀ (peak isometric force). The curve drops fast at first — most of the force is lost early in the velocity range — then flattens. Peak mechanical power (force × velocity) sits at roughly 30 % of F₀ and 30 % of V₀. That intersection is the region “explosive” training targets.
Force–velocity curve vs. load–velocity profile
These are not the same thing. Easy to confuse because both plot force-ish quantities against speed.
The force–velocity curve is theoretical — derived from isolated-muscle physiology (Hill, frog sartorius, 1938). Force here means the contractile force of a muscle fibre or muscle group. Velocity is the shortening velocity of those fibres. You don’t measure this directly in the gym; you infer it from indirect tests.
The load–velocity profile is practical — the line you get when you plot bar speed against external load on an actual lift (squat, bench, deadlift). Load is what’s on the barbell. Velocity is what your tracker measures. The relationship is approximately linear across the working-load range, not hyperbolic, because the lift is a multi-joint, coordinated movement constrained by leverage, technique, and accommodating resistance — not an isolated muscle fibre.
Same shape family, different measurement, different scale, different interpretation. The force–velocity curve tells you what your contractile machinery is capable of in principle. The load–velocity profile tells you what’s happening on the bar tomorrow.
When to use it
- Conceptual framing for power training. Pick a load that lands you near the peak-power region of the curve, not the strength end and not the speed end.
- Training-mode selection. Heavy strength work shifts the high-force end up; ballistic / unloaded jumps push the high-velocity end out. Both move the whole curve, from different sides.
- Diagnosing a stuck lifter. If max strength is good but rate of force development is poor, the left side of the curve is healthy and the right side isn’t — train fast loads.
Pitfalls
- Confusing F–V with L–V. They live at different scales — muscle vs. barbell. Use the right one for the question.
- Treating it as static. The curve isn’t an immutable property; it shifts with training. The interesting question is which side you’re moving.
- Optimising peak power without context. Peak-power load is a useful heuristic for ballistic blocks; a bad one for max strength or heavy hypertrophy.
Where to go next
For the practical analogue, see the Load–velocity profile chart — the lift-specific version coaches actually plot. The Max power calculator finds the load that puts you near the peak-power region of your personal curve. The broader topic page on VBT for power walks through how to program around it.
Download high res chart images
High-resolution PNG, 1600×1000, watermarked. Free to share, embed in slides, or print. Credit appreciated.