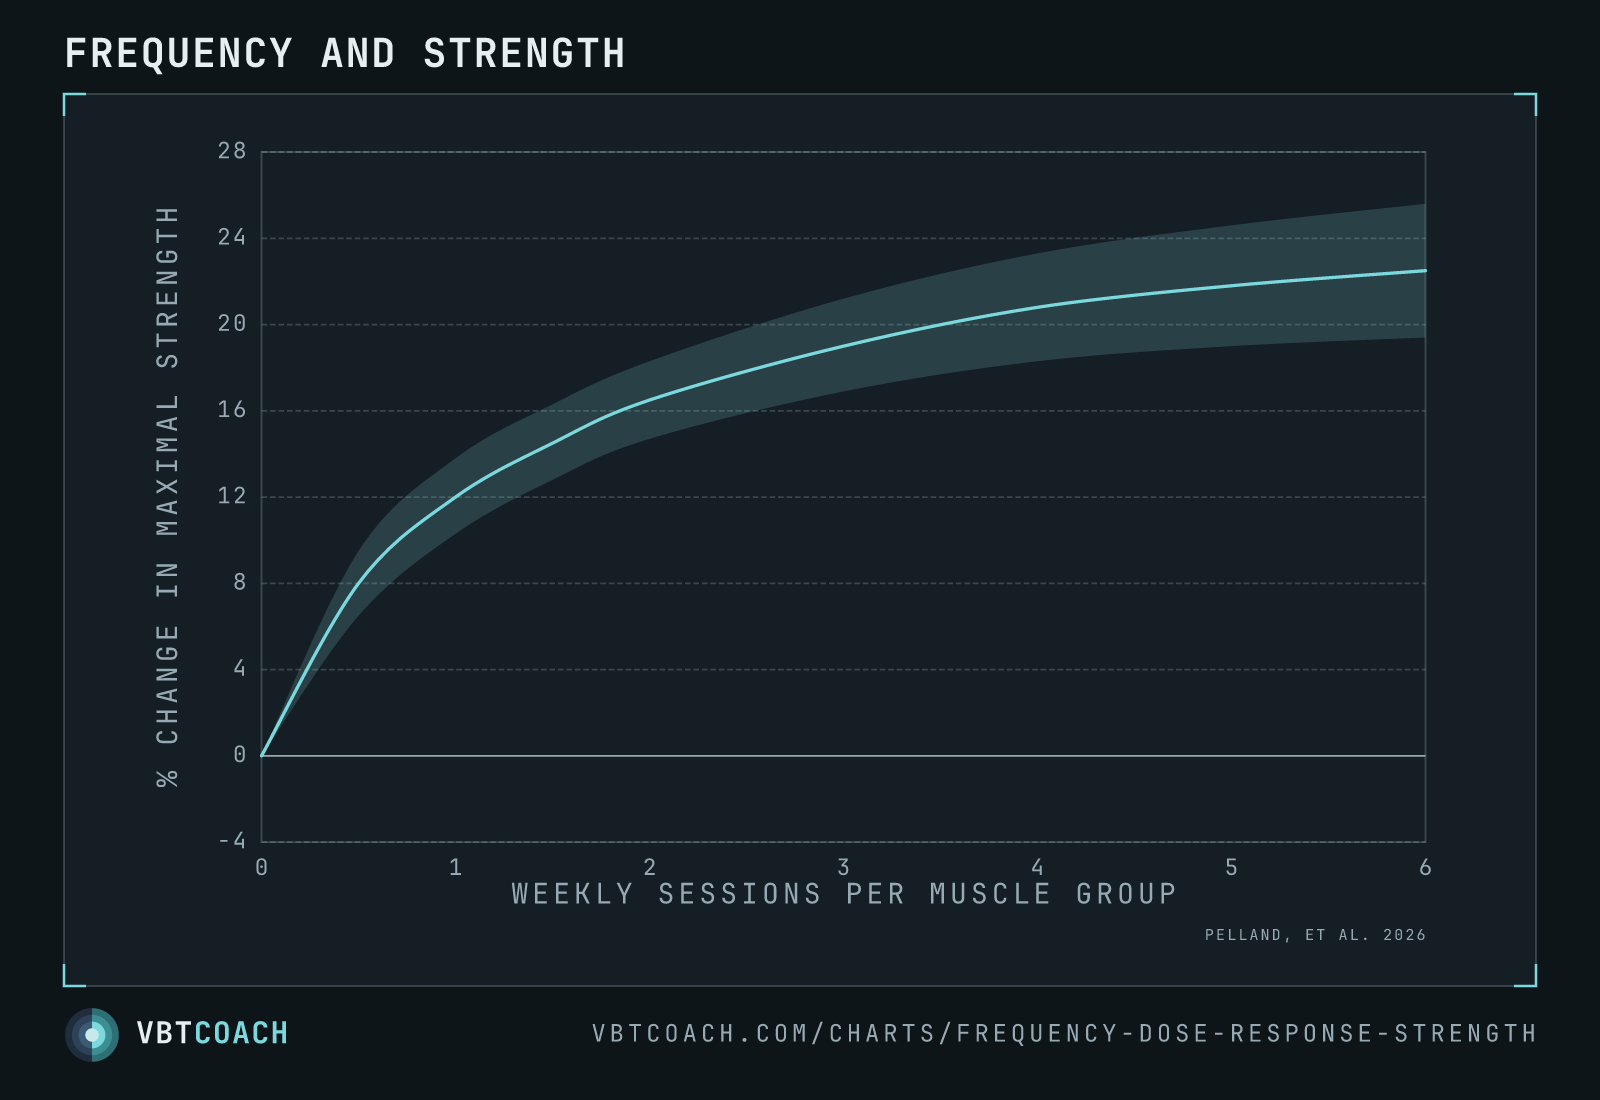
Pelland 2026 — training frequency and strength gain, with volume held constant
Pelland 2026 — 67 studies, 2,058 participants. With weekly set volume controlled, strength gains rise with frequency and the credible interval never touches zero. Diminishing returns past two sessions.
The same meta-regression that produced the volume dose-response — 67 studies, 2,058 participants — turning the other dial. Weekly set volume is held constant here; the only thing changing is how many sessions that volume is spread across.
How to read this chart
The curve is the modelled average change in maximal strength at each weekly frequency. The band is the 95 % credible interval. The line at zero is no change.
The band never touches zero. At every frequency on the chart, the model is confident the effect is positive — the paper reports a 100 % posterior probability of a positive slope. That is the one structural difference from the hypertrophy chart, and it’s the whole finding.
The second thing to read is the shape. It’s steep early and close to flat late:
- Most of the effect is bought by about two sessions per muscle group per week.
- Past four, the curve is nearly horizontal — more frequency, almost no more strength.
Why frequency is a strength lever, not a size one
The same model found frequency’s effect on hypertrophy was compatible with nothing at all — the posterior probability of a positive slope came in under 100 %, which the authors read as “compatibility with negligible effects”. Strength was the outlier at 100 %.
That split makes mechanical sense. Strength is a skill as much as an adaptation. Spreading the same total work across more sessions means more separate exposures to the movement — more practice at the pattern, at the brace, at the bar path — and more of that work done fresh rather than deep into a fatigued session.
Muscle mostly cares how much work it got. The nervous system cares how it was scheduled.
What this means in a program
- Squat and pull twice a week rather than once, even at identical weekly sets. The chart says the split alone is worth something.
- Stop at three or four. The curve has flattened, and the sessions still cost you recovery, time and adherence.
- This is where VBT earns its keep. Higher frequency only pays if the extra sessions are productive. Bar speed tells you whether today’s session is contributing or just adding fatigue — see velocity loss and readiness-driven programming.
The honest caveats
- Values are read off the published figure. Shape and clearance above zero are right; don’t quote them to a decimal.
- The published figure carries more. The individual-effect scatter and a wider prediction interval are both omitted here for readability.
- “Frequency” is fractional. An indirect set — chest work counting toward triceps, say — counts as half. A frequency of 3 is not three dedicated sessions.
Source: Pelland, J. C., Remmert, J. F., Robinson, Z. P., Hinson, S. R., Zourdos, M. C. (2026). The Resistance Training Dose Response: Meta-Regressions Exploring the Effects of Weekly Volume and Frequency on Muscle Hypertrophy and Strength Gains. Sports Medicine, 56(2), 481–505.
Download high res chart images
High-resolution PNG, 1600×1000, watermarked. Free to share, embed in slides, or print. Credit appreciated.