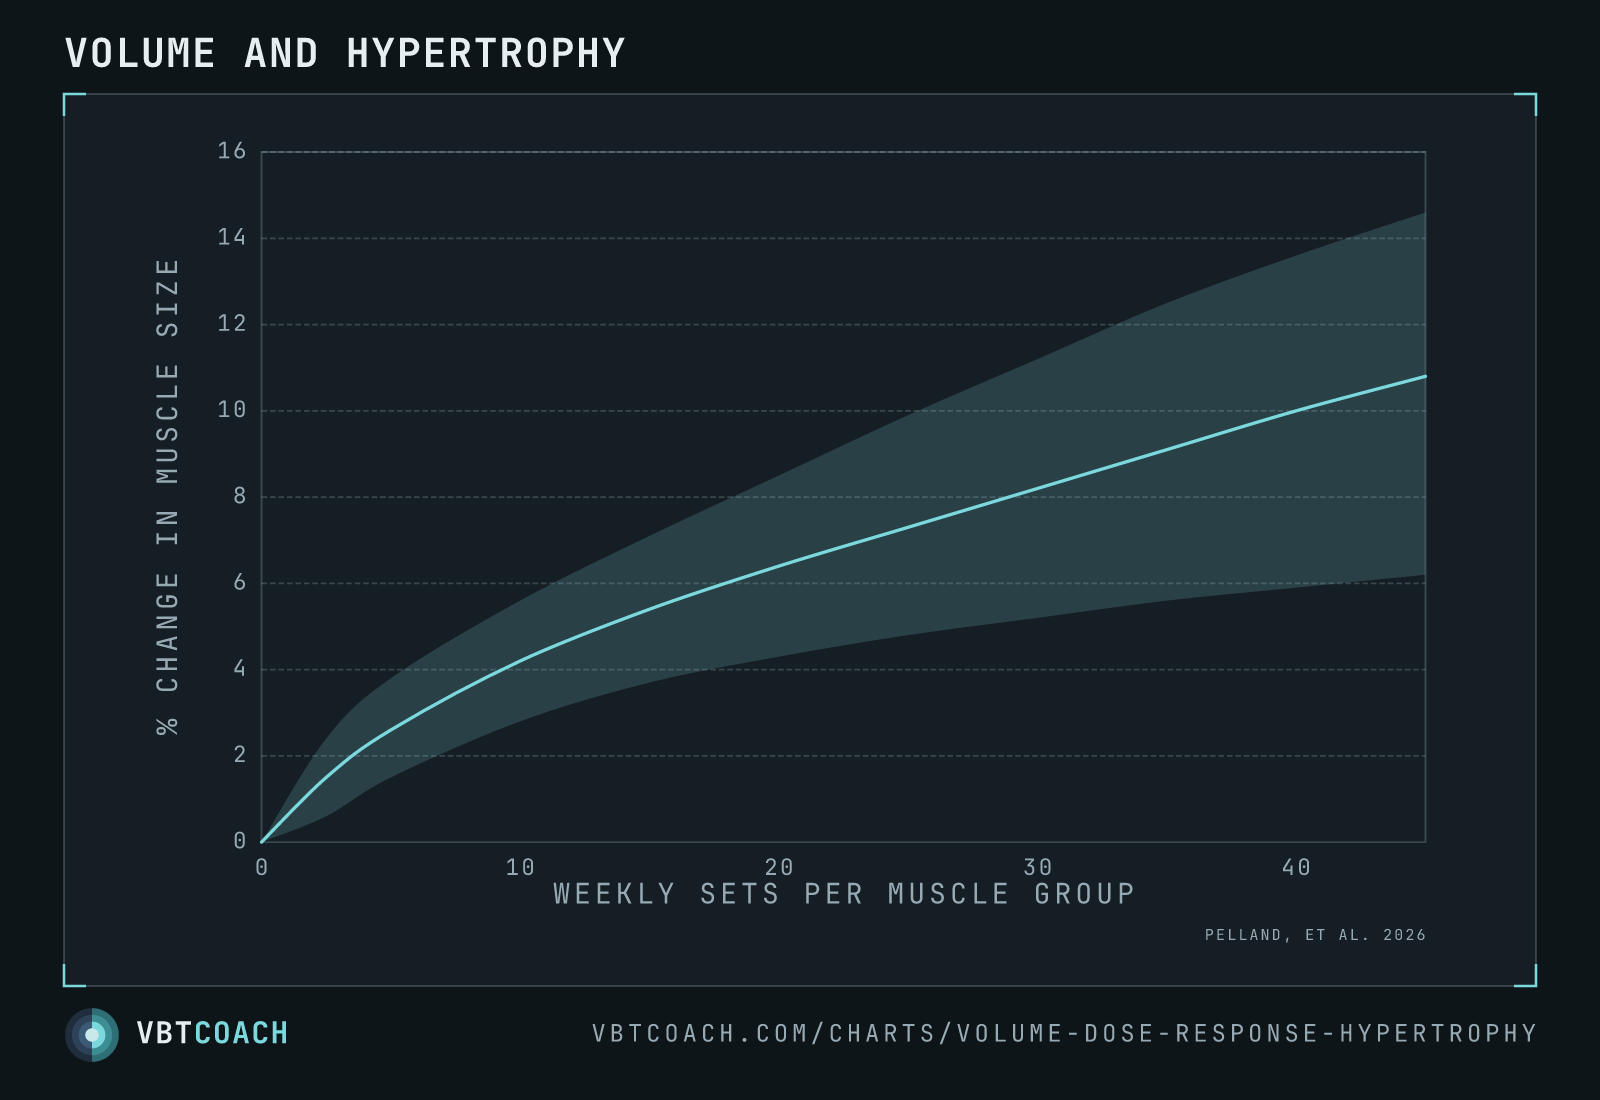
Pelland 2026 — weekly set volume and muscle growth, out to 45 sets
Pelland 2026 — 67 studies, 2,058 participants. Muscle growth rises with weekly sets across the whole range the literature covers, with diminishing returns and a credible interval that never touches zero.
A meta-regression of 67 studies and 2,058 participants, asking the oldest question in the gym: how many sets?
How to read this chart
The curve is the modelled average change in muscle size at each weekly set count. The shaded band is the 95 % credible interval — the range the model considers compatible with the data. The flat line at zero is no change.
Two things to read:
- The band clears zero from about two sets a week and stays clear all the way out. The paper reports a 100 % posterior probability of a positive slope. More sets, more muscle — this one isn’t in doubt.
- The curve bends but never turns over. Growth is roughly 4 % at 10 weekly sets, 8 % at 30, and still climbing at 45. The returns diminish; they don’t reverse inside the range these studies cover.
What this means in a program
The honest headline is that there’s no ceiling visible in the data, and that is not the same as “do 45 sets”.
- The first ten sets are the cheap ones. Half the growth on this chart is bought by set ten. Everything after that costs progressively more work for progressively less.
- The curve is an average of a literature, not a prescription for you. The band is wide, and it widens as volume climbs, because very few studies ran that high.
- Nothing here prices the cost. Forty-five sets a week for one muscle group is a recovery, time and joint-health decision that this model doesn’t make. The chart says the growth curve is still rising. It doesn’t say the rest of you is.
- “Sets” here is fractional. An indirect set — chest work counting toward triceps, say — counts as half. Ten fractional sets is not ten dedicated ones.
Where this meets VBT
This is the chart that makes velocity loss useful. If more volume keeps paying but each set costs more than the last, the question stops being “how many sets” and becomes “how many of these sets are still productive”. Bar speed answers that within the session rather than in hindsight — see velocity loss.
The honest caveats
- Values are read off the published figure. Shape and clearance above zero are right; don’t quote them to a decimal.
- The published figure carries more. The scatter of every individual effect estimate and a wider prediction interval are both omitted here — they bury the credible interval, which is the part that answers the question.
The other lever
Volume is one of two dials the paper turned. The other is frequency, and it behaves differently — it buys strength but not reliably size. See frequency and strength.
Source: Pelland, J. C., Remmert, J. F., Robinson, Z. P., Hinson, S. R., Zourdos, M. C. (2026). The Resistance Training Dose Response: Meta-Regressions Exploring the Effects of Weekly Volume and Frequency on Muscle Hypertrophy and Strength Gains. Sports Medicine, 56(2), 481–505.
Download high res chart images
High-resolution PNG, 1600×1000, watermarked. Free to share, embed in slides, or print. Credit appreciated.