Dorrell 2020 — Individualised VBT out-gains group-mean VBT on every measure
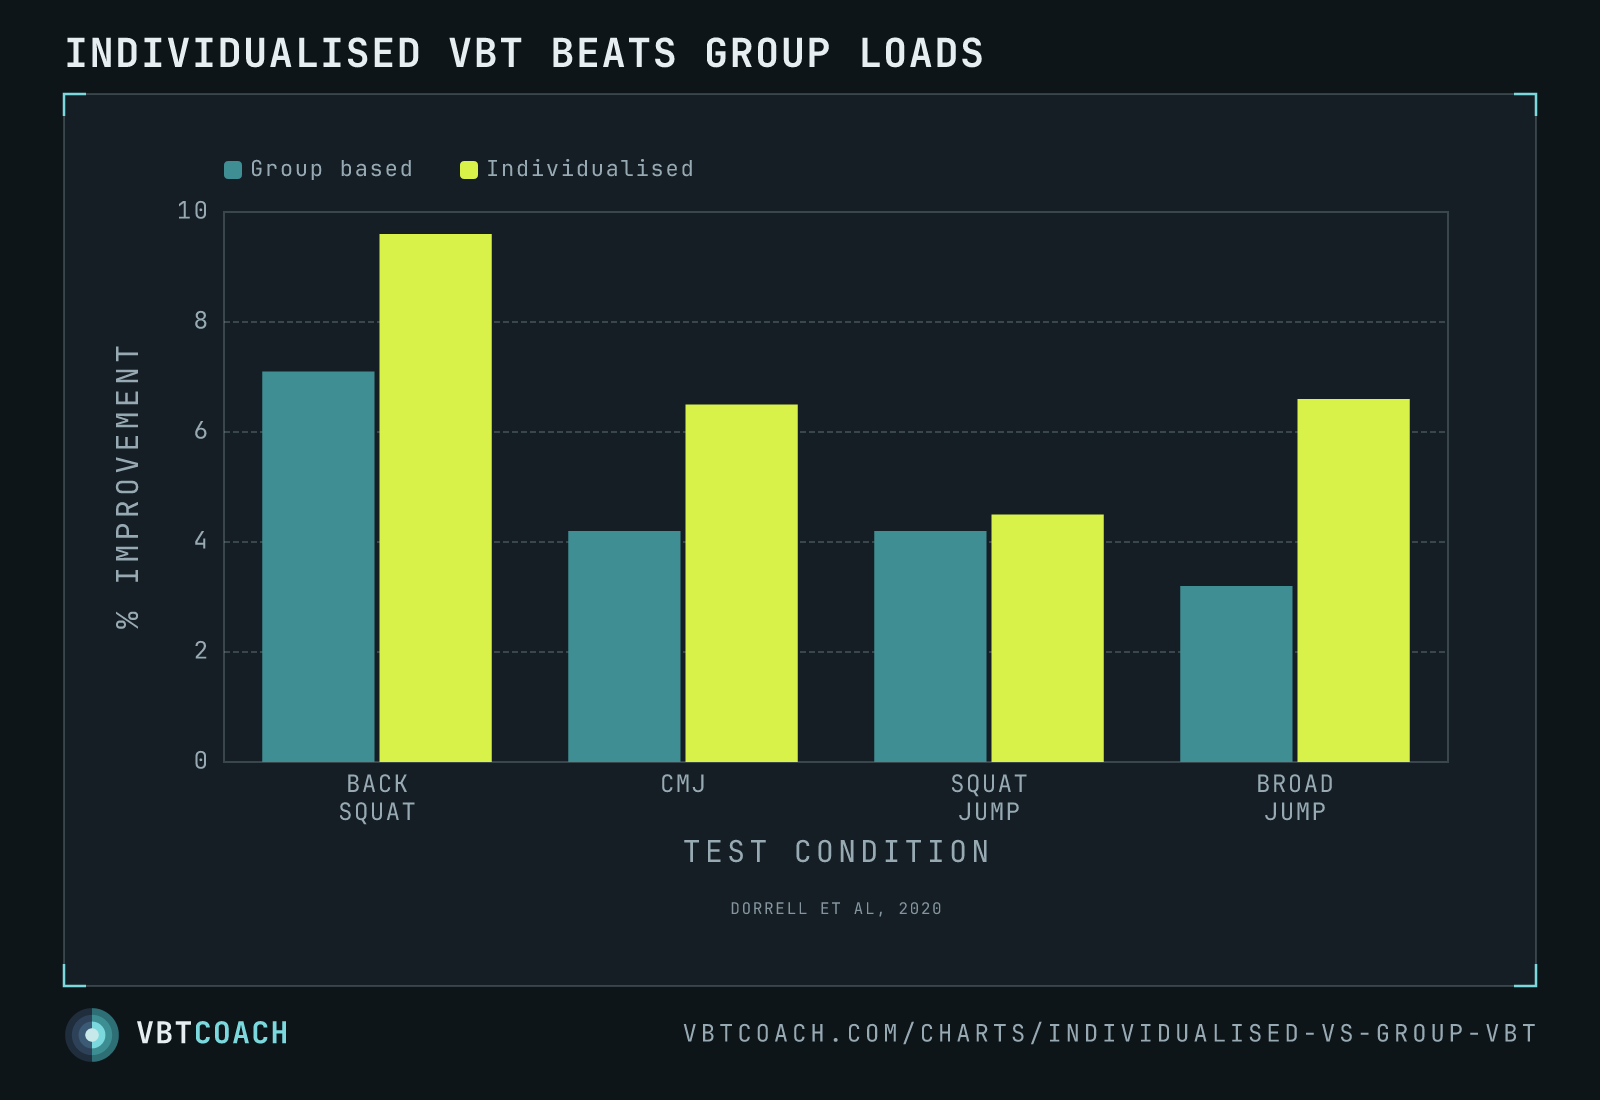
Dorrell 2020 — six weeks of VBT, with one group prescribed loads from a shared group-mean profile and the other from each athlete's own load-velocity profile. The individualised group out-gained on every measure.
Dorrell and colleagues took two groups of trained athletes through six weeks of velocity-based training. Both groups had access to the same VBT methodology — same exercises, same volume, same intent. The difference: one group used a shared group-mean load-velocity profile to prescribe daily loads, the other used each athlete’s own profile. The individualised group out-gained on every outcome.
How to read this chart
Four outcome categories across the bottom: back squat 1RM, countermovement jump, squat jump, broad jump. Navy bars are the group-based-prescription cohort, teal bars are the individualised-prescription cohort. Y-axis is percentage change in performance from baseline.
The biggest gap sits on back squat 1RM (9.6 % vs 7.1 %) and broad jump (6.6 % vs 3.2 %) — over twice the gain on broad jump for the individualised group. Squat jump is essentially tied (4.5 % vs 4.2 %) — when both groups are doing nearly-identical training, some outcomes won’t separate.
When to use this evidence
- Defending the cost of profiling each athlete. Building an LV profile per athlete takes time. This chart is the case for spending it: prescribed loads from the wrong profile blunt adaptation across multiple outcomes.
- Programming team-sport environments. Group-mean prescription is the default in team settings (one program, many athletes). Dorrell shows the cost of that convenience — measurable across most performance metrics.
- Coaching mixed-ability groups. A weak lifter and a strong lifter using the same group-mean LV profile both get the wrong load on a given day. Individualisation fixes both directions.
Why individualised profiles win
Each athlete’s load-velocity relationship has its own slope and intercept (see the load-velocity profile chart and its by-lift variant for the across-lift version of the same point). A group-mean profile averages those individual variations; the resulting loads are right for an “average” athlete that may not exist in the group. For the strength-biased lifter, group prescription runs too light at high loads. For the speed-biased lifter, it runs too heavy. Across six weeks, both end up under-stimulated.
The individualised condition replaces that average with each athlete’s actual profile. Every working set lands at the intended relative intensity for that specific lifter, on that specific lift — and the multi-week training stimulus accumulates accordingly.
Pitfalls
- Profiling cost. Building a profile requires multiple sub-maximal sets across several loads, plus the device and time to do it. For a 30-athlete squad, that’s a real upfront commitment.
- Profile maintenance. Individual profiles drift with training. Re-test every 4-6 weeks or the prescription drifts back toward stale.
- Six-week timescale. As with Muñoz de la Cruz 2023, the gap likely narrows over longer studies. The direction is robust; the magnitude shrinks.
Where to go next
For the per-athlete profile concept this study assumes, see the Load–velocity profile chart, which includes the by-lift variant alongside the canonical view. To build profiles for a team, the Load–velocity profile generator is the interactive tool. The protocol guide is How to create an athletic profile with VBT.
Download high res chart images
High-resolution PNG, 1600×1000, watermarked. Free to share, embed in slides, or print. Credit appreciated.