Power output by exercise — why the powerlifts are not power lifts
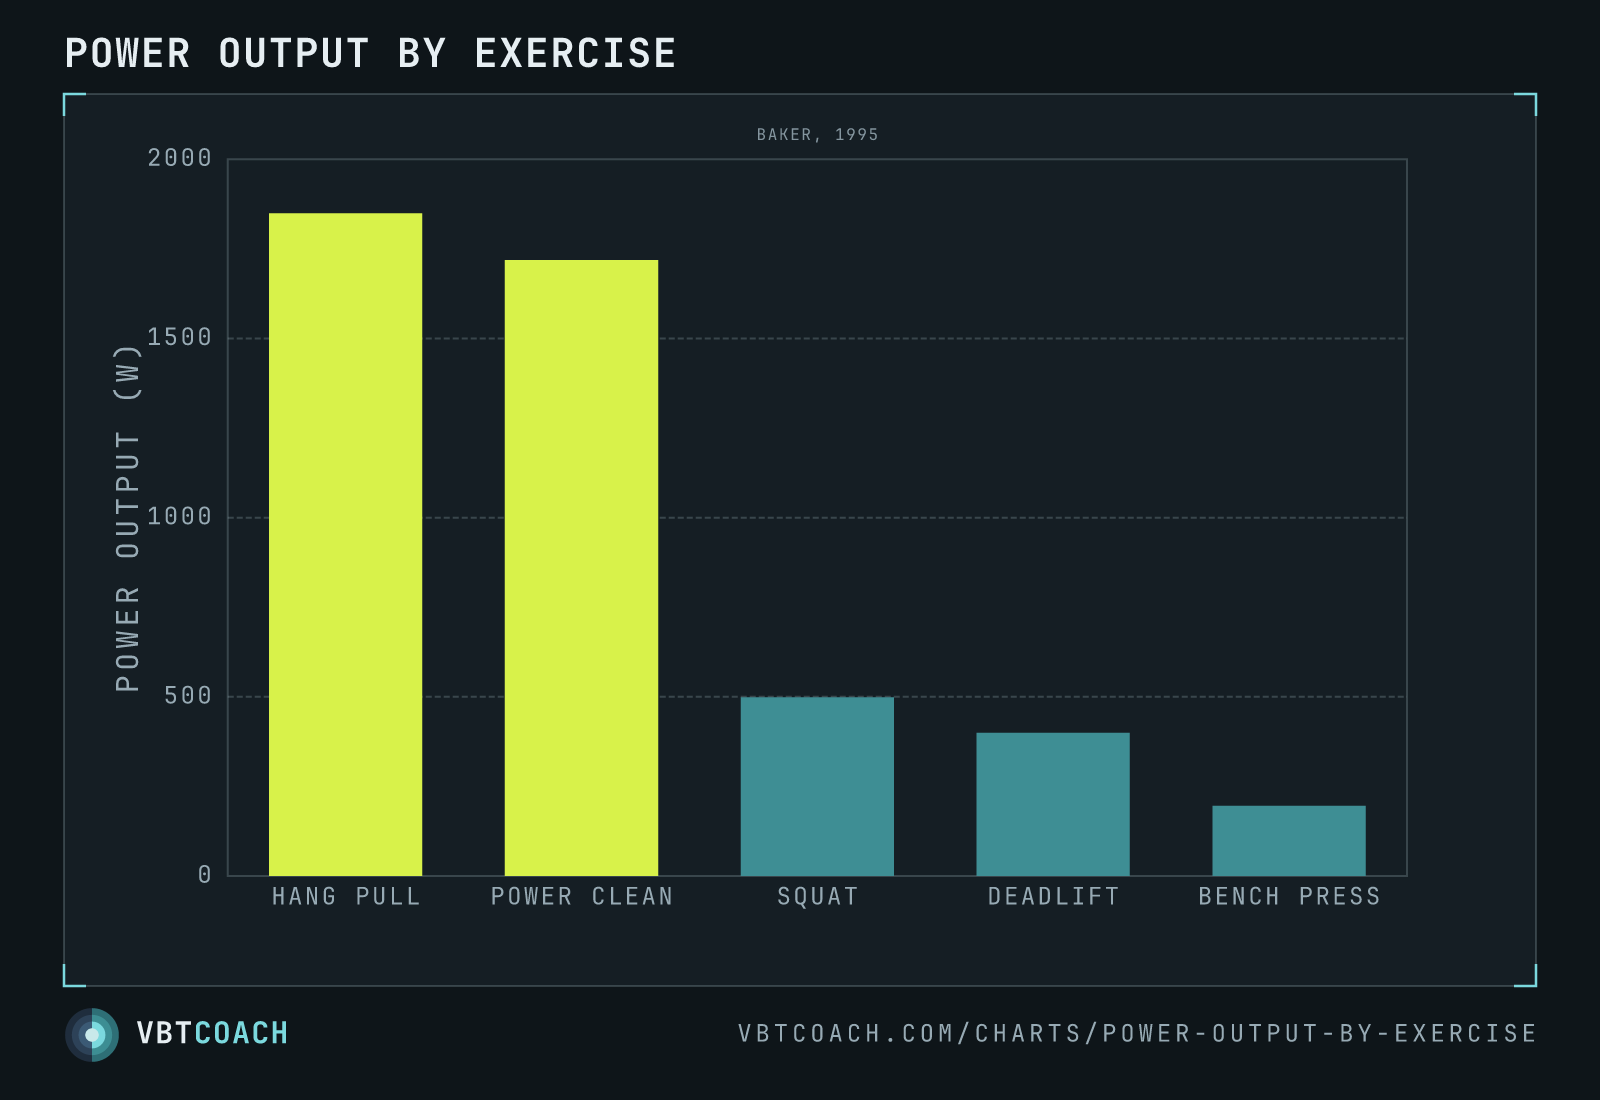
Baker 1995 — estimated power output at 100 % 1RM across five exercises for one 75 kg athlete. The hang pull and power clean produce 3–9 times the watts of the squat, deadlift and bench press.
Not every exercise is a vehicle for power. The name on the sport is misleading: powerlifting is a maximal-strength sport performed slowly, and its three lifts sit at the bottom of this chart.
Baker (1995) calculated mechanical power — (mass × 9.81 × height) ÷ time — for a set of exercises performed by the same theoretical 75 kg athlete at 100 % of 1RM, using normative displacement and execution times for each lift. Same lifter, same body mass, same method: the only variable is the exercise.
What the chart says
The lifts fall into two families with almost nothing in between:
- Olympic-derived movements: ~1700–1850 W. Hang pull 1849 W, power clean 1719 W.
- Traditional strength lifts: ~200–500 W. Squat 499 W, deadlift 400 W, bench press 196 W.
The power clean produces roughly 3.4 times the power of a squat and nearly nine times a bench press. That gap is not a matter of effort or intent — it is structural. Power is work divided by time, and a 420 kg squat that takes 2.75 seconds cannot compete with a lighter bar moved further in under a second.
How to read it without over-reading it
Three honest caveats, none of which change the conclusion:
- These are calculations, not measurements. They depend on the displacement and execution times Baker assigned each lift. A powerlifter would argue with the 2-second bench press. The Olympic-to-traditional gap is far larger than any plausible disagreement about those inputs.
- Baker’s other Olympic derivatives all land at ~1716 W — squat clean, clean pull and split jerk — because his work-to-time ratios converge there, not because the lifts are truly identical. They are left off the chart for that reason: read the family, not a ranking inside it.
- This is 100 % of 1RM. No exercise produces its peak power at its heaviest load — see the maximum-power load–power profile. The submaximal load that maximises power differs by lift: roughly 80–90 % 1RM for the Olympic lifts, 40–60 % for traditional strength exercises, and 30–40 % for jump squats.
What to do with it
If a training block is aimed at power, the exercise selection carries more of the result than the effort does. Squatting harder does not convert a squat into a power exercise.
That does not make the powerlifts worthless — they build the strength half of the equation, and strength is what the Olympic derivatives express. It makes them the wrong tool for the conversion phase. Jump squats and bench press throws are the practical middle ground: Baker reports single loaded jump squats reaching 1869–3559 W and multiple-repetition jump squats reaching 3936–4726 W, which is Olympic-lift territory without the years of technical work.
For where power sits in a velocity-based programme, see power and the practical value of power metrics in the weight room.
Download high res chart images
High-resolution PNG, 1600×1000, watermarked. Free to share, embed in slides, or print. Credit appreciated.