Maximum-power load–power profile — reading peak power and the load that produces it
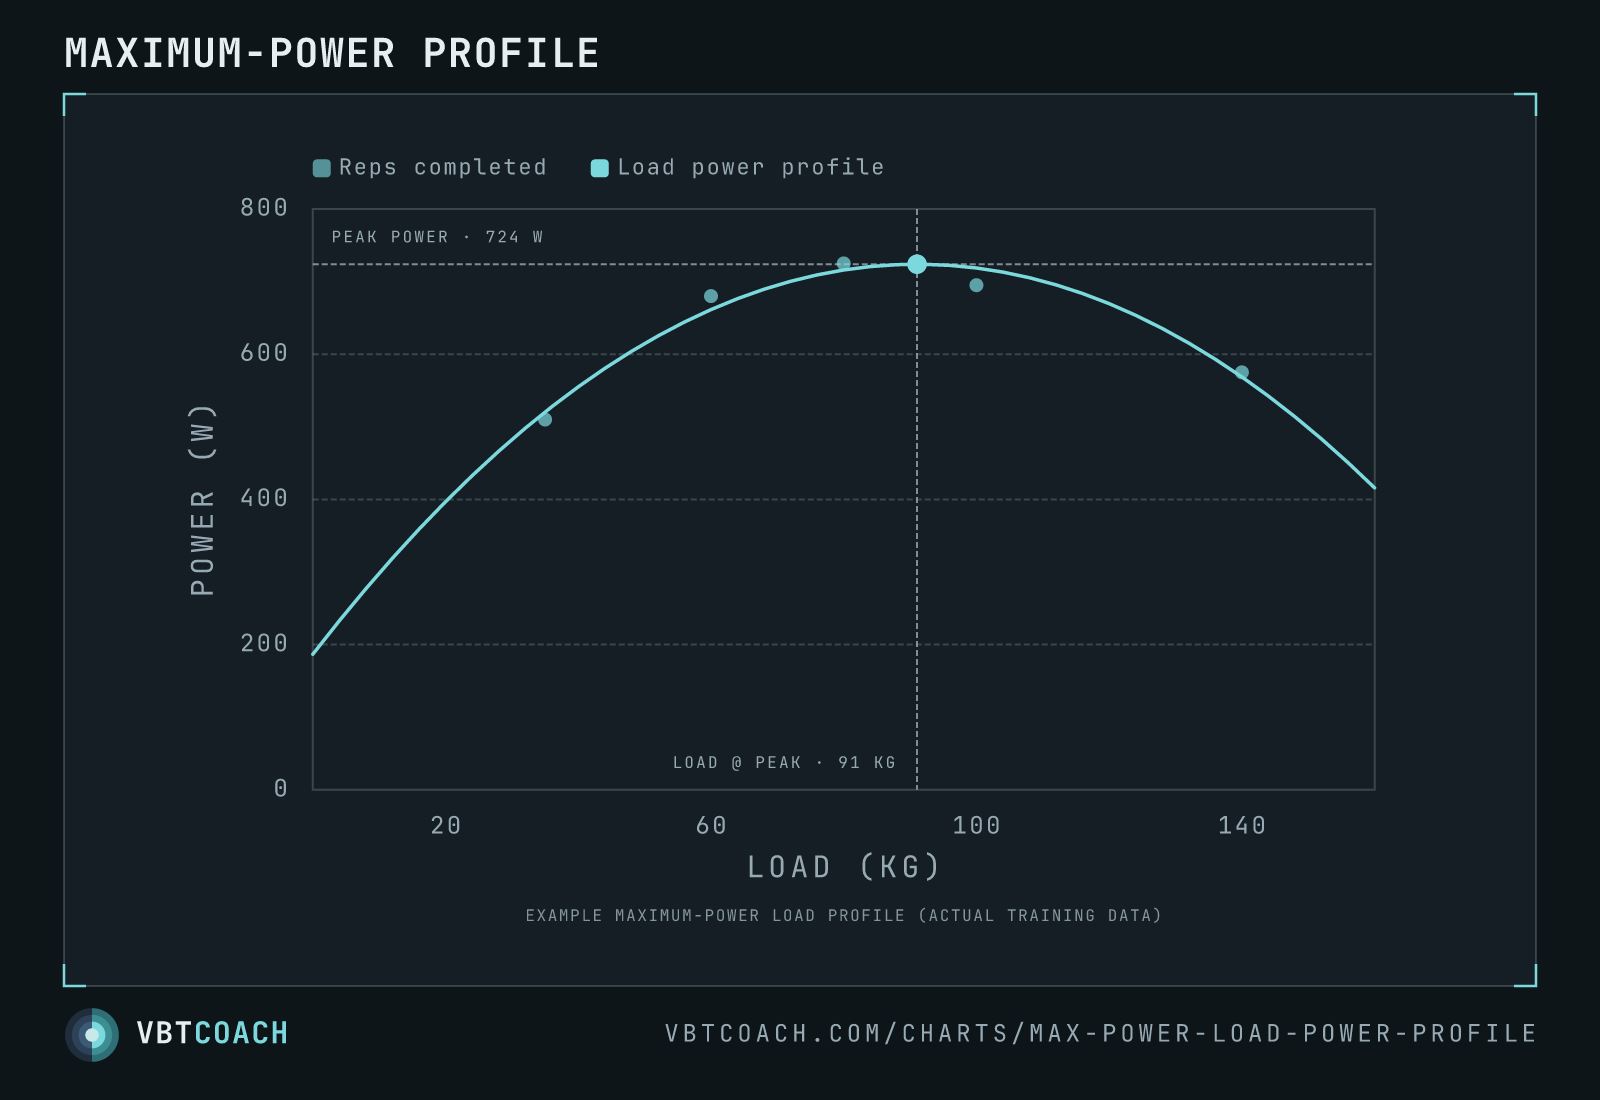
A load–power profile with the apex called out — a horizontal dashed line at peak power in watts and a vertical dashed line at the load that produces it, meeting at the maximum-power point.
This is the load–power profile with the one number most people actually want drawn straight onto it: the maximum-power point. Force rises with load and velocity falls, so their product — power — peaks somewhere in the middle of the load range. This chart fits the parabola through your measured load/power pairs, then annotates the apex the same way the 1RM crossing is drawn on a load–velocity profile: a horizontal dashed line at peak power, a vertical dashed line at the load that produces it, and a solid marker where they cross.
How to read this chart
- The horizontal dashed line sits at peak power in watts — the most mechanical power this athlete produced across the working range.
- The vertical dashed line drops to the load (kg) where that peak occurs — the maximum-power load.
- The marker where they meet is the apex of the parabola: read both numbers off it directly, no guessing where the top of the curve sits.
For most lifters the maximum-power load lands around 30–50 % 1RM on the squat and bench, a little higher on the deadlift. Where yours falls depends on your strength-vs-speed bias and how power is measured.
When to use it
- Programming a power block. The maximum-power load is the anchor for dynamic-effort work — load near it and drive maximal bar speed.
- Tracking progress honestly. Both the height of the apex (watts) and its position (load) move with training. A rising peak-power line at the same load is a cleaner readiness and progress signal than a single max attempt.
- Comparing athletes. Two lifters with the same 1RM can peak at very different loads; the vertical line tells you who is speed-strong and who is force-strong.
Pitfalls
- Peak-power load is not automatically your training load. It’s the output metric. For max strength, train heavier; for sport-specific rate of force development, train near the apex.
- Mean vs. peak power. Peak instantaneous power and mean power over the rep peak at different loads — pick one metric and stay consistent.
- The apex drifts. Re-test every 4–6 weeks so the annotated point reflects current data, not history.
Where to go next
Find your own apex with the Max power calculator, and see the un-annotated shape on the Load–power profile.
Download high res chart images
High-resolution PNG, 1600×1000, watermarked. Free to share, embed in slides, or print. Credit appreciated.