Prilepin's chart — reps, intensity, and optimal session volume from the canonical Soviet matrix
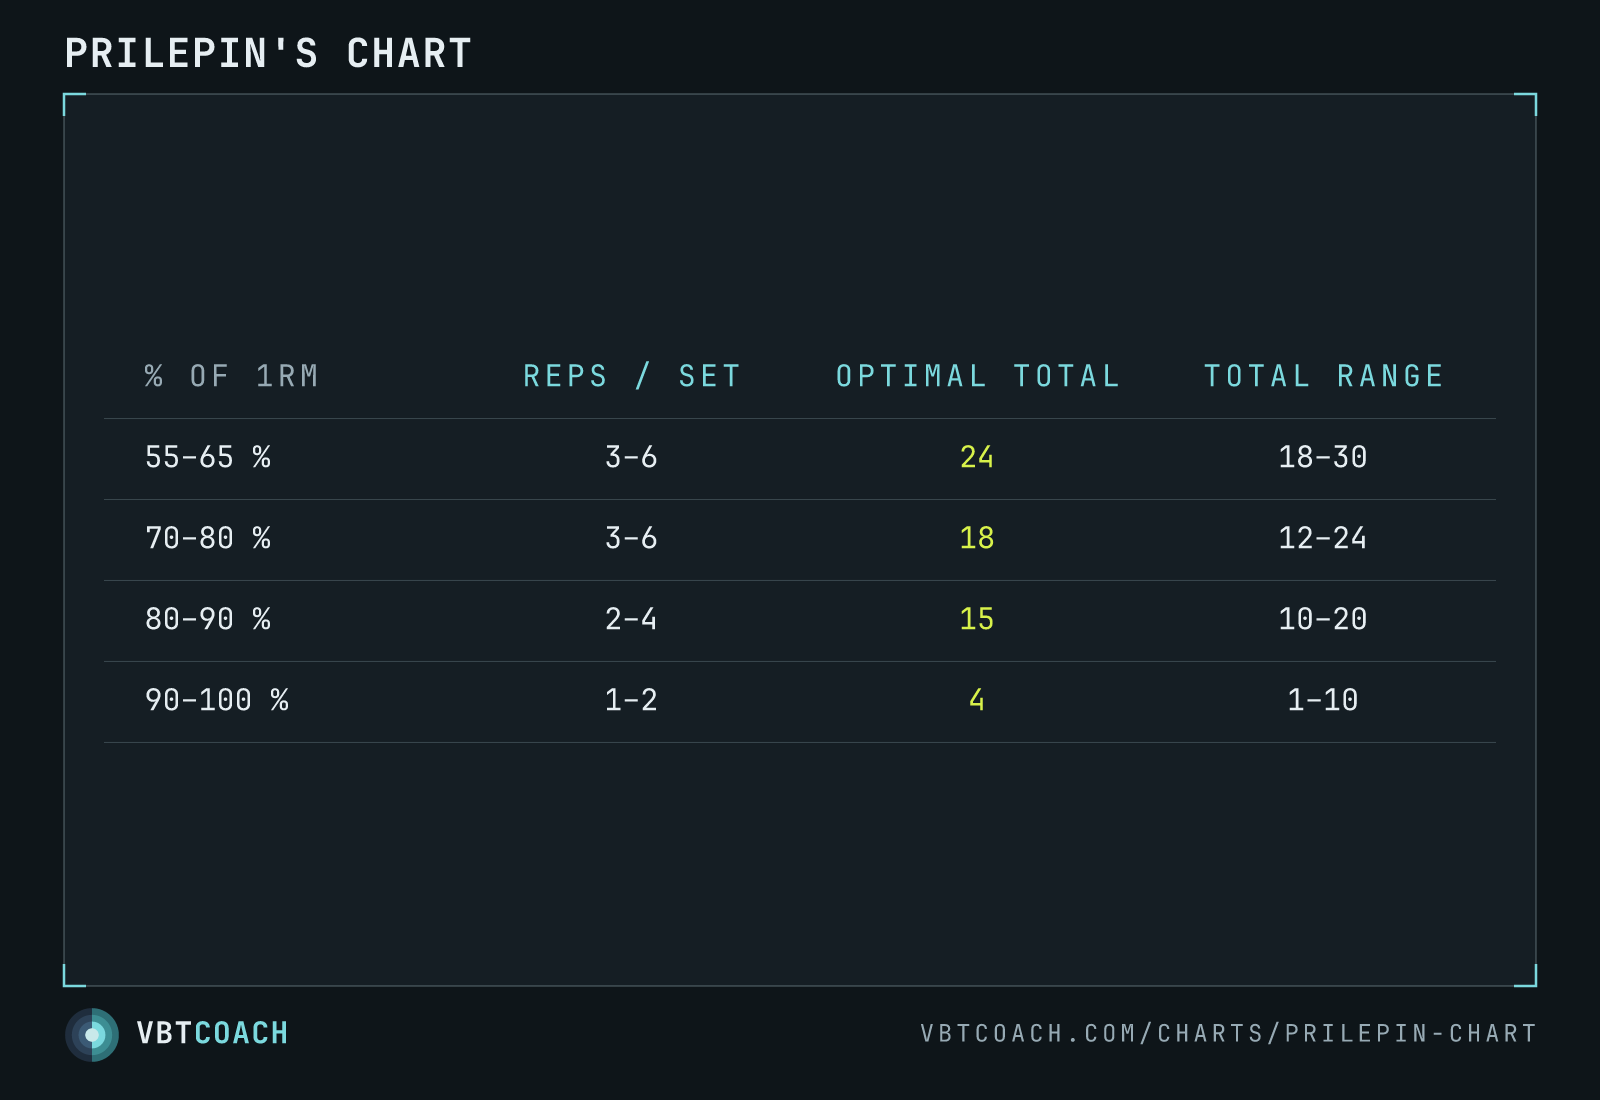
The canonical reps × intensity × session-volume table from Soviet weightlifting research. For each load band, the prescribed reps per set, optimal session total, and acceptable total range.
Prilepin’s chart is the canonical Soviet-era prescription matrix for resistance training. For each intensity band, it specifies a reps-per-set range, an optimal target for session-total reps, and a wider acceptable range. Originally calibrated for Olympic weightlifting, the chart has migrated into general strength training as a shorthand for “how much volume should this load produce in one session?” The values aren’t sacred — but they’re a useful starting prescription when you’re picking volume and intensity from scratch.
How to read this chart
Each row is an intensity band on the % 1RM axis. The columns are:
- Reps / set — how many reps to do per working set at this intensity. Pick toward the high end for novices and the low end for elite lifters.
- Optimal total — the bullseye for total session-reps at this intensity. The number Prilepin’s data identified as the sweet spot of stimulus-to-fatigue.
- Total range — the acceptable session-rep range. Land outside this and you’re either under-stimulating (too few reps) or grinding through fatigue (too many).
A typical session with 80–90 % 1RM working sets aims for 15 total session reps, achieved across 2–4 reps per set — so something like 5 × 3 or 4 × 4 hits the bullseye. A heavier 90–100 % session caps at 4 total reps, achieved as 1–2 per set — a 4 × 1 or 2 × 2 day, not a high-volume grind.
When to use this chart
- Drafting a strength block from scratch. Prilepin’s numbers give you a defensible starting point for set × rep × intensity prescription.
- Sanity-checking a program. A 3 × 8 at 85 % 1RM lands at 24 reps, well outside the 80–90 % band’s 10–20 range. The chart flags it as too much volume for that intensity.
- Spotting under-loading. A 3 × 5 at 70 % 1RM lands at 15 reps — also outside the 70–80 % band’s 12–24. In this direction the underload is bigger than it looks.
What the chart isn’t
Prilepin’s chart was derived from Olympic weightlifters performing the snatch and clean and jerk. It has been broadly adopted into general strength training, but the original calibration matters:
- Not lift-specific. Bench, deadlift, and squat respond differently to the same per-set rep counts than the Olympic lifts do. Bench at 85 % × 4 isn’t the same systemic stress as a clean at 85 % × 4.
- Not goal-specific. Prilepin’s bullseye is strength-and-power output. Hypertrophy training routinely pushes session totals past these ranges (and tolerates more rep-per-set).
- Not effort-aware. The chart doesn’t distinguish between sub-failure reps and failure reps. Modern programming (RPE, RIR, velocity-loss) layers effort on top of intensity; Prilepin’s framework is intensity-only.
Pitfalls
- 65–70 % gap. The chart skips the 65–70 % band — a quirk of the original Soviet research, not an instruction. For loads in that gap, interpolate between the 55–65 % and 70–80 % rows.
- Treating the bullseye as gospel. “Optimal” in the chart means “best across a Soviet population of weightlifters in the 1970s.” Modern athletes, modern training methods, and individual variation all shift the optimum.
- Forgetting it’s a starting point. Use it to draft the program, then adjust based on real-world bar speed, RPE feedback, and longitudinal progress.
Where to go next
For an effort-aware alternative to Prilepin’s intensity-only framework, see the RPE × reps table — same idea but with RPE on the second axis. For the modern velocity-based take on volume management, velocity-loss guidelines covers how v-loss caps replace reps-per-set prescription. The reps-to-1RM lookup table on the same RPE page gives you a direct converter from “reps achieved” to ”% 1RM trained.”
Download high res chart images
High-resolution PNG, 1600×1000, watermarked. Free to share, embed in slides, or print. Credit appreciated.