Reliability vs validity — why consistent data beats accurate data in VBT
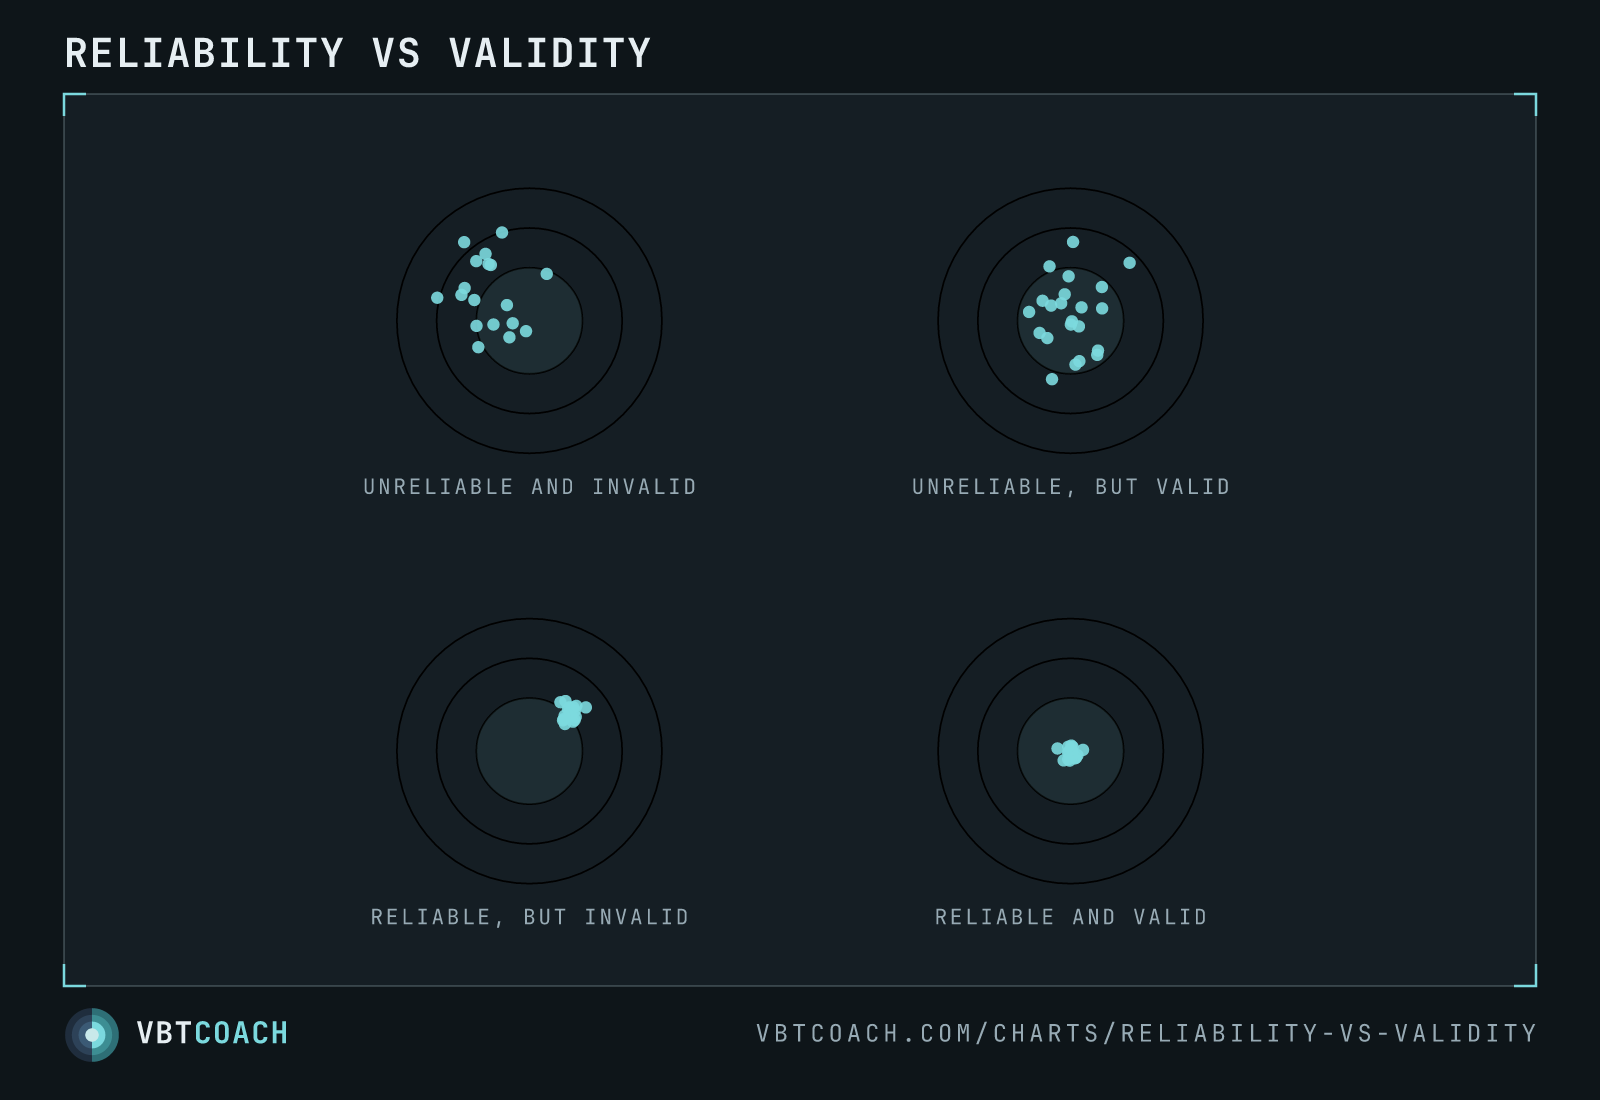
The classic 2×2 target illustration. Validity is hitting the bullseye; reliability is grouping tightly. For day-to-day velocity-based training, a tight group in the wrong spot beats a loose scatter around the right one.
Two different questions get asked of any measurement. Validity: is it hitting the true value? Reliability: does it land in the same place every time? The four targets show every combination — and for velocity-based training, the counter-intuitive lesson is that the bottom-left target (tight but off-centre) is more useful than the top-right (centred but scattered).
How to read this chart
Each dartboard is one measurement repeated many times; every dot is a reading. The bullseye is the true value.
- Unreliable and invalid — dots scattered wide and biased off-centre. Useless: neither accurate nor consistent.
- Unreliable, but valid — dots scattered wide but centred on the bullseye. The average is right, but any single reading could be way off.
- Reliable, but invalid — a tight cluster in the wrong place. Every reading is consistent, just offset from the truth.
- Reliable and valid — a tight cluster on the bullseye. Ideal.
Why reliability wins for VBT
For coaching, you rarely need the absolute truth — you need to see change. If a device reads 10 % slow but reads 10 % slow every single time, the trends are still real: a drop today versus last week reflects a real drop in the athlete. That’s the “reliable but invalid” target, and it’s genuinely useful for autoregulation and tracking readiness.
A device that’s accurate on average but noisy rep to rep — “unreliable but valid” — is the trap. Any single session could be off by enough to hide fatigue or fake a PR. This is the core problem with peak velocity: it’s pulled from a tiny slice of the rep, so it scatters like the top targets, while mean and propulsive velocity group like the bottom ones.
Where to go next
See why peak velocity scatters — the spiky underlying signal — on the acceleration-time graph, and the full case in Is everything we know about VBT wrong?.
Download high res chart images
High-resolution PNG, 1600×1000, watermarked. Free to share, embed in slides, or print. Credit appreciated.