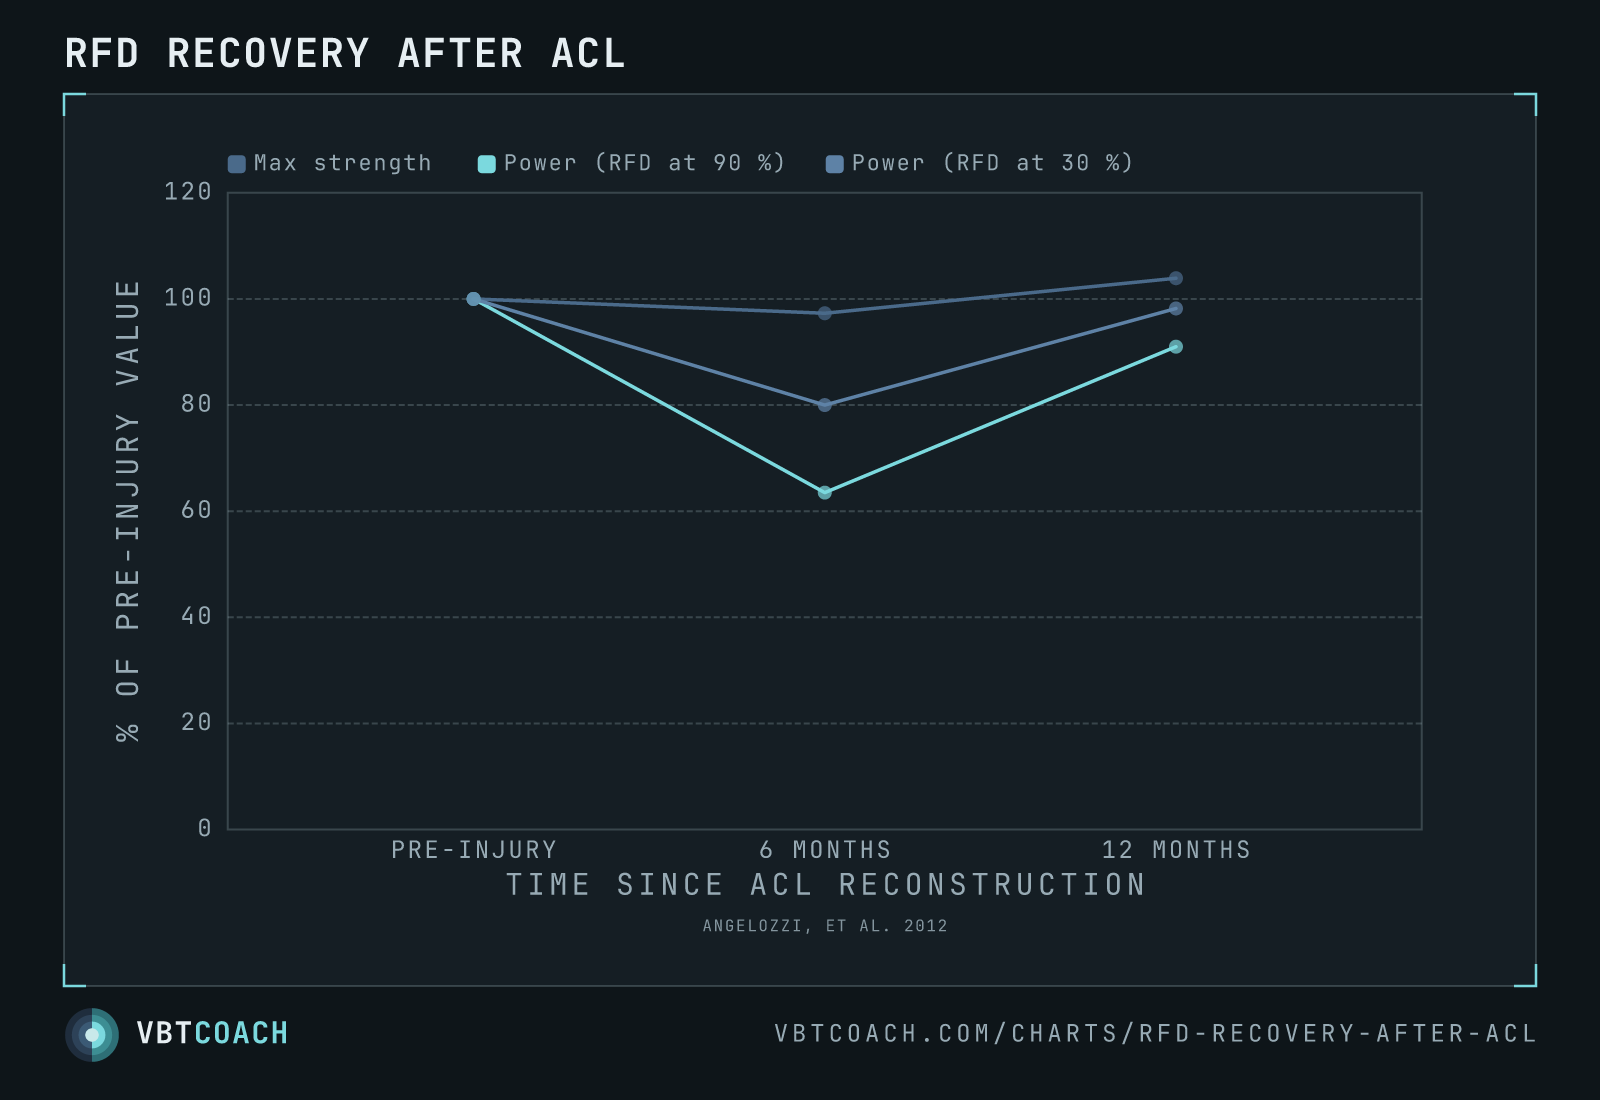
Angelozzi 2012 — maximal strength recovers after ACL reconstruction, explosive strength doesn't
Angelozzi 2012 — 44 athletes tested before injury and at 6 and 12 months after ACL reconstruction. At 6 months maximal strength was back to 97 % of pre-injury while rate of force development sat at 80 % and 63 %.
Forty-four athletes who had an arthroscopic ACL reconstruction, tested three times: at a routine preseason assessment before the injury happened, then at 6 and 12 months post-surgery.
That pre-injury baseline is what makes this study worth a chart. Almost every ACL study compares the reconstructed limb to the uninjured one, which quietly assumes the uninjured side stayed put through a year of altered training. Here each athlete is measured against their own healthy self.
How to read this chart
All three measures are indexed to each athlete’s pre-injury value at 100 %, and all three are the reconstructed limb.
At 6 months the lines are in completely different places:
- Max strength: 97 %. Essentially recovered. On the conventional clearance criterion — 85–90 % of the contralateral limb’s maximal strength — this athlete passes.
- Power, RFD at 30 %: 80 %. A fifth gone.
- Power, RFD at 90 %: 63 %. More than a third gone.
By 12 months all three are back — max strength at 104 % of pre-injury, RFD30 at 98 %, RFD90 at 91 %.
The gradient is the point
Notice that the deficit scales with how fast the force is wanted. Ask for force at a modest rate and 80 % of it is there. Ask for it at the rate a landing demands and only 63 % arrives.
A single RFD line would have stated the deficit. Two state the gradient — and the gradient is what tells you the missing quality is speed of force production specifically, not a general shortfall that a bit more strength work would cover.
All three thresholds
The paper measured RFD at three points. The chart plots the two ends; RFD50 sits between them and is left off only because it adds a line without adding a fact. Full set, involved limb, as a percentage of pre-injury:
| Measure | 6 months | 12 months |
|---|---|---|
| Max strength (MVIC) | 97 % | 104 % |
| RFD at 30 % of MVIC | 80 % (P = .04) | 98 % (P = .86) |
| RFD at 50 % of MVIC | 77 % (P = .03) | 93 % (P = .51) |
| RFD at 90 % of MVIC | 63 % (P = .01) | 91 % (P = .56) |
Every RFD threshold was significantly down at 6 months and every one had recovered by 12. RFD90 is the biggest of three deficits that all point the same way — the most time-critical threshold, and the one closest to what a landing or a cut actually demands.
Why this is the most important chart on this site for anyone rehabbing a knee
Two-thirds of athletes who have an ACL reconstruction never return to their previous level, and reinjury rates run from 3 % to 19 %. The standard clearance test is a maximal strength test.
This chart shows that test passing an athlete who has lost a third of their ability to produce force quickly — and an ACL doesn’t tear during a slow maximal effort. It tears in the first 50 milliseconds of a landing, a cut, a deceleration. Maximal strength has essentially nothing to say about that window.
A 6-month clearance based on MVIC alone is measuring the quality that recovered and ignoring the one that didn’t.
What to do about it
- Test the rate, not just the peak. RFD, or any velocity-based equivalent, belongs in the return-to-sport battery alongside the strength number.
- Treat 6 months as a floor, not a target. In this cohort the explosive quality needed the full 12 months.
- This is a strong argument for velocity tracking in rehab. Load lifted tells you the force half. Bar speed tells you whether force is arriving fast enough to matter — see power and why peak-power metrics need care.
Caveats
- Single cohort, no control group. Descriptive prospective design, 44 athletes, one rehabilitation protocol.
- RFD is not bar-barbell power. These are isometric measures from a fixed rig, not a loaded lift. The quality generalises; the numbers don’t transfer directly.
- Twelve months is this cohort’s answer, not a universal timeline. Rehab protocol, graft type and sport all move it.
Source: Angelozzi, M., Madama, M., Corsica, C., Calvisi, V., Properzi, G., McCaw, S. T., Cacchio, A. (2012). Rate of Force Development as an Adjunctive Outcome Measure for Return-to-Sport Decisions After Anterior Cruciate Ligament Reconstruction. Journal of Orthopaedic & Sports Physical Therapy, 42(9), 772–780.
Download high res chart images
High-resolution PNG, 1600×1000, watermarked. Free to share, embed in slides, or print. Credit appreciated.