Peterson 2005 — Training short of failure beats failure at every set count
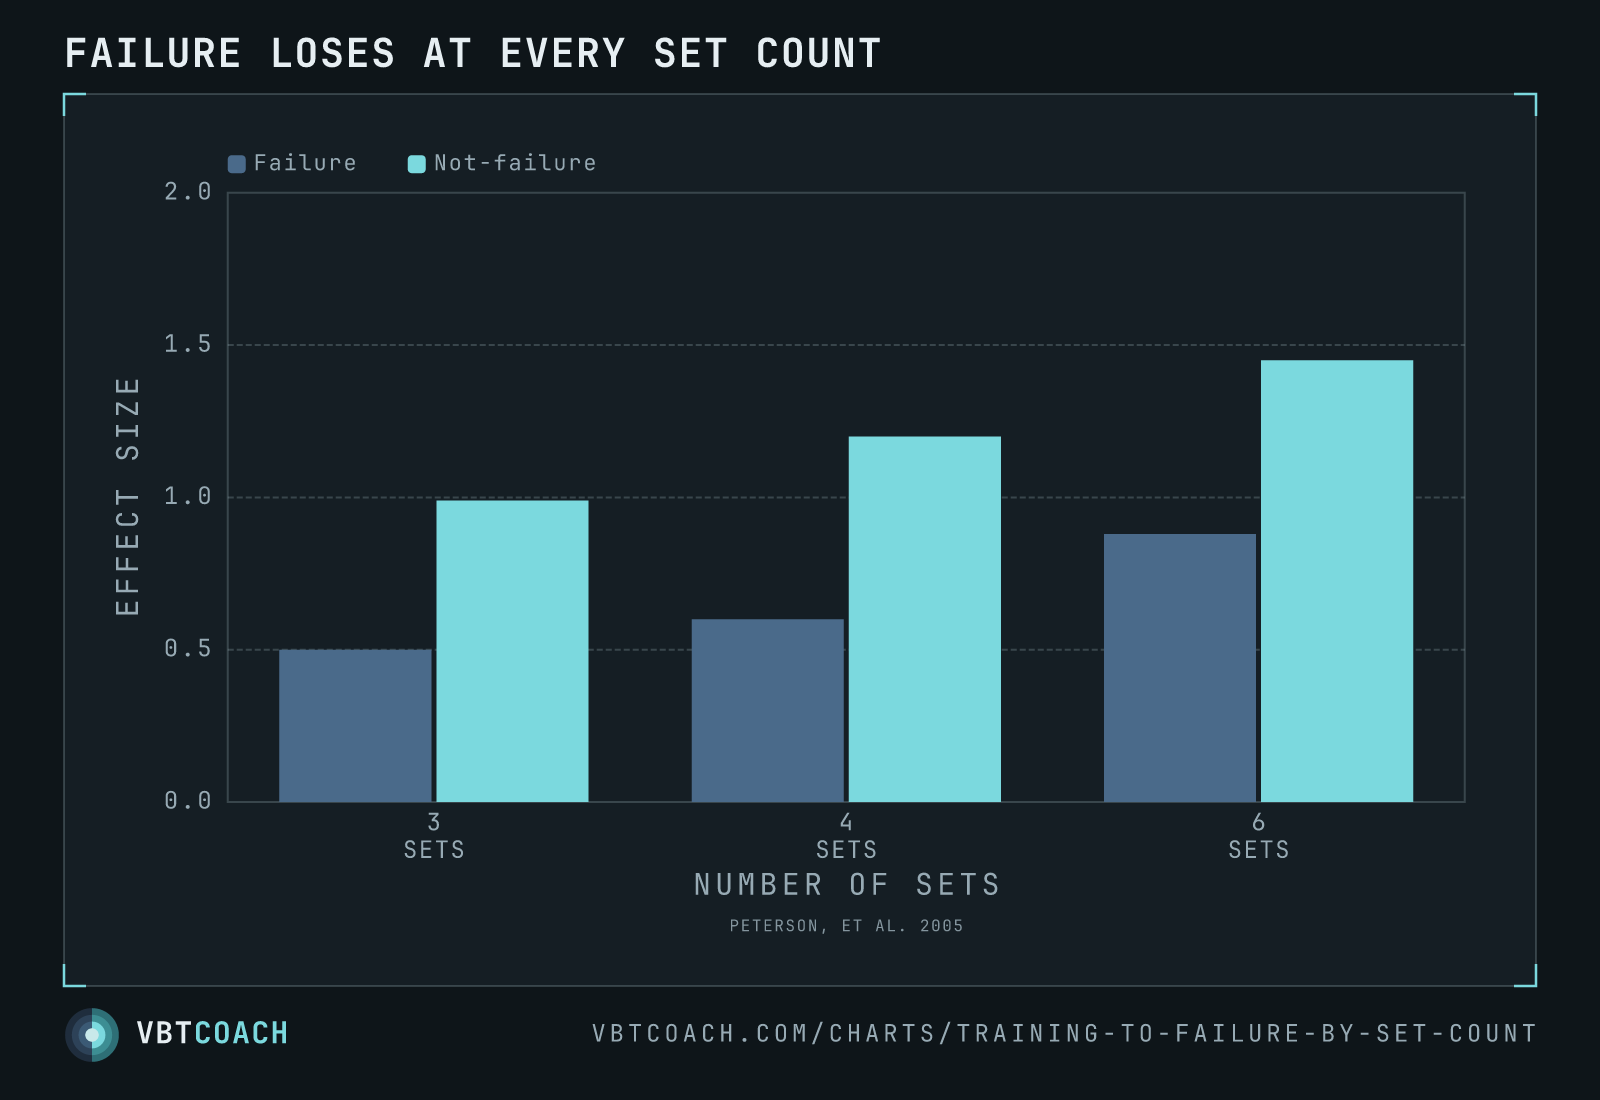
Peterson 2005 (meta-analysis) — strength effect-size for not-to-failure conditions exceeded failure conditions at every set count, and the gap widened with more sets.
Peterson’s 2005 meta-analysis aggregated dose–response findings across many resistance-training studies and segmented them by set count. The headline isn’t surprising — not-to-failure training consistently out-performs failure training. The interesting finding is what happens as you add sets: the gap widens rather than narrowing. More volume amplifies the cost of training to failure, not the benefit.
How to read this chart
Three set-count conditions across the bottom: 3 sets, 4 sets, 6 sets. Navy bars are training to failure, teal bars are not-to-failure. Y-axis is effect size — a standardised measure of how much each condition produced relative to baseline / control.
At 3 sets, not-failure (0.99) is roughly double failure (0.50). At 4 sets, the gap grows: 1.20 vs 0.60. At 6 sets, 1.45 vs 0.88. The not-failure curve grows faster with more sets; the failure curve grows slower. Adding volume to a failure-training protocol doesn’t catch up — it lets the not-failure protocol pull further ahead.
When to use this evidence
- Justifying volume increases on sub-failure programming. “More sets” pays off harder when the sets aren’t to failure. Don’t expect a higher set count to rescue a failure-training block.
- Designing accumulation phases. Adding sets while staying further from failure is the cleanest path to bigger weekly volume without proportionate fatigue cost.
- Reframing “training hard.” Hard sessions don’t require failure sets. They require intent across more total sets, which is exactly what sub-failure training preserves.
Why volume amplifies the gap
Each failure rep produces a small adaptive stimulus and a large fatigue cost. Across 3 sets, the fatigue is manageable; across 6 sets, fatigue compounds non-linearly. Meanwhile, the not-failure group’s reps each carry a similar (small) adaptive stimulus but a fraction of the fatigue cost. As set counts climb, the fatigue penalty on the failure group eats more of their adaptation, while the not-failure group keeps converting reps into gains at a stable ratio.
Pitfalls
- Meta-analyses smooth over individual studies. This chart represents an aggregate; some individual studies show smaller or larger gaps. The direction is robust; the magnitude isn’t.
- Volume and intensity interact. This was set-count, not load-count. Increasing load per set under failure training has different dynamics than increasing set count.
- Hypertrophy vs strength. This was a strength-focused meta-analysis. The hypertrophy literature has more support for higher-effort sets in some populations.
Where to go next
The longitudinal companion charts — training to failure long-term and training to failure short-term — show what happens within one cohort taken across 8 weeks (long-term) or 48 hours post-session (short-term). The case in prose is the risk and reward of training to failure.
Download high res chart images
High-resolution PNG, 1600×1000, watermarked. Free to share, embed in slides, or print. Credit appreciated.