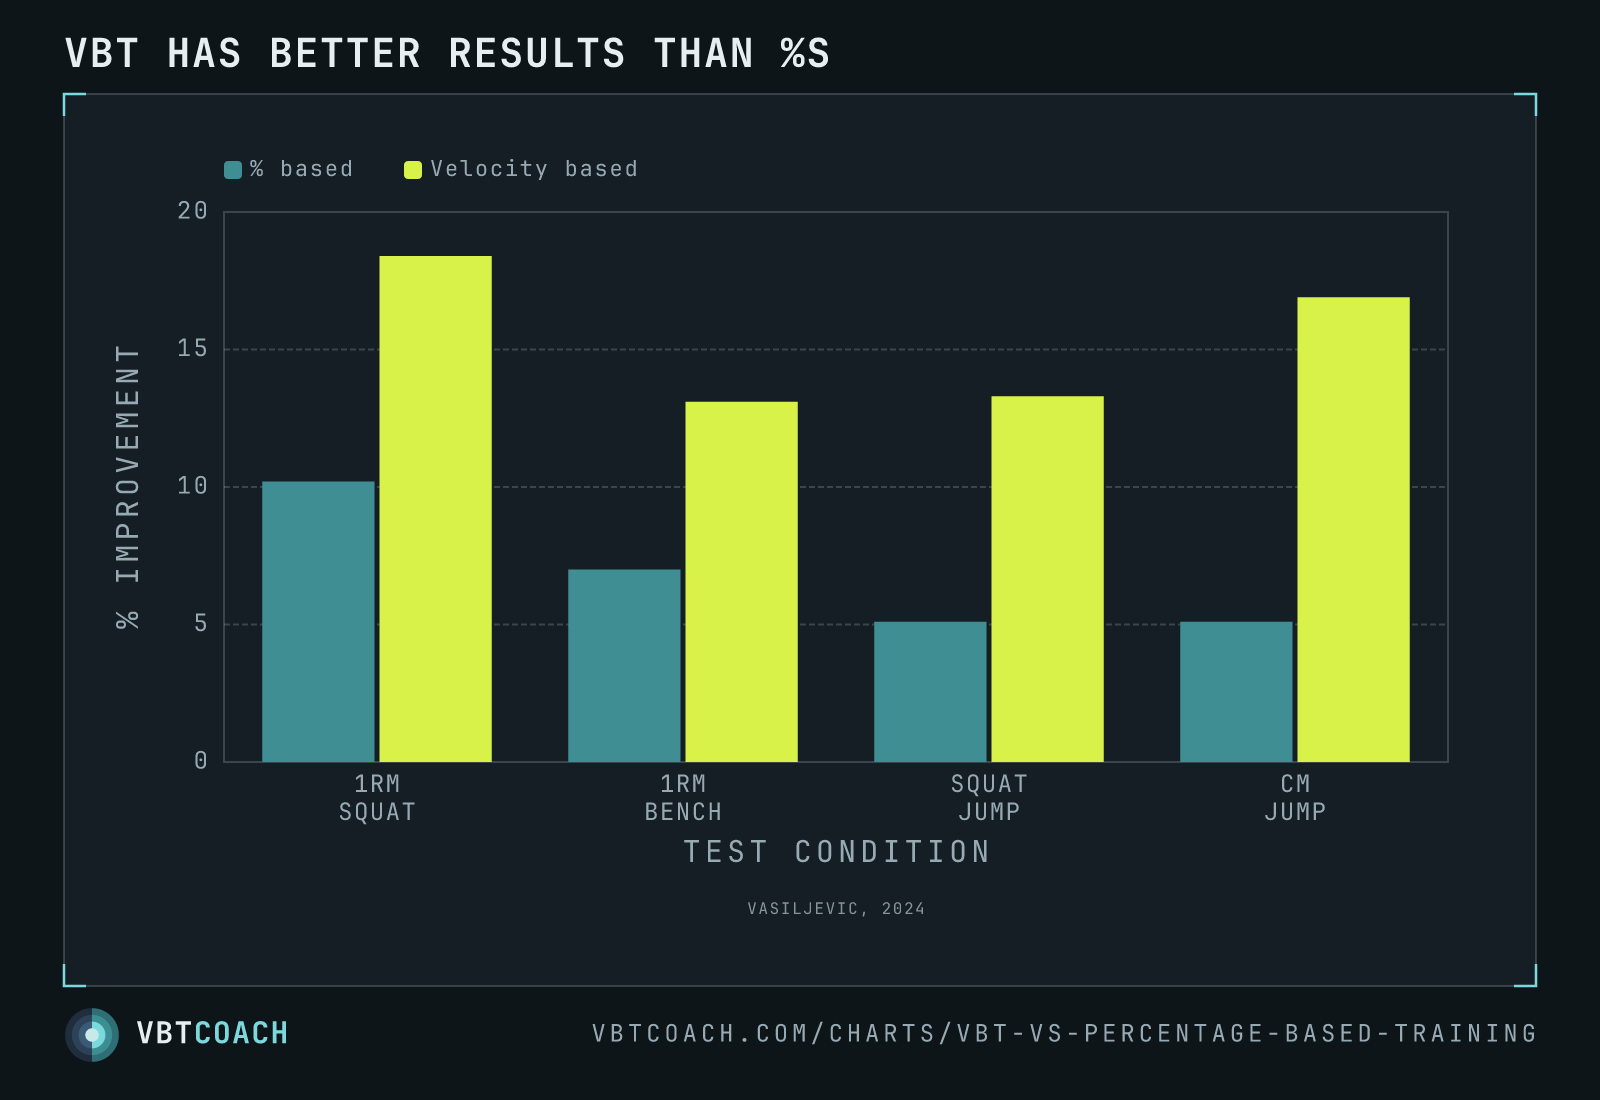
Vasiljevic 2024 — VBT out-gains percentage-based training on strength and power
Vasiljevic 2024 — velocity-based training out-performed percentage-based on every test, including 1RM squat, 1RM bench, squat jump, and countermovement jump.
Vasiljevic and colleagues ran a clean 8-week head-to-head between velocity-based and percentage-based training. Same exercises. Same volume. Same average intensity. The only difference was how each group decided when to stop a set: VBT athletes capped at a velocity-loss threshold, %-based athletes stopped at a fixed rep count. The VBT group out-performed on every single outcome.
How to read this chart
Each pair of bars is one outcome measure. Navy is the percentage-based group, teal is the velocity-based group. Every category — 1RM squat, 1RM bench, squat jump, countermovement jump — shows VBT roughly doubling the %-based group’s improvement. The biggest gap sits on the squat jump and CM jump (the explosive measures) where the VBT group gained ~2.5–3× as much.
When to use this evidence
- Justifying VBT to a sceptical coach or athlete. “Same loads, same effort, but the readout-driven group gained more.” It’s the cleanest comparison study to date.
- Picking how to terminate sets. This is the operational difference: pre-prescribed reps vs. velocity-loss cutoff. The latter wins because it adjusts to the day.
- Programming a power block. The transfer effect to jump performance — the chart’s two right-most bars — argues for VBT specifically when neuromuscular outcomes matter.
Why VBT outperforms %-based
The mechanism is auto-regulation. On any given day, an athlete’s true working capacity drifts ± 5–10 % from their nominal 1RM. A %-based program prescribes a fixed load that’s slightly too heavy on bad days and slightly too light on good ones. A VBT program reads bar speed each rep and stops when the actual effort tips into wasteful fatigue. Over 8 weeks, that adaptive termination accumulates into measurably better outcomes.
Pitfalls
- Small sample. This is one well-controlled trial, not a meta-analysis. Other VBT studies show smaller effect sizes; the direction is robust, the magnitude isn’t.
- Trained-population specifics. Vasiljevic used trained males. Effects on novices, masters athletes, and women may scale differently.
- It’s not “VBT is magic.” The win comes from auto-regulation, not from velocity per se. RPE-based termination would likely produce similar outcomes — VBT is just a more measurable version of the same principle.
Where to go next
For the practical guide on building VBT into a program, see the complete 1RM and VBT guide. To put a load–velocity profile to work for your own training, the Load–velocity profile chart and Load–velocity profile generator are the everyday tools.
Download high res chart images
High-resolution PNG, 1600×1000, watermarked. Free to share, embed in slides, or print. Credit appreciated.