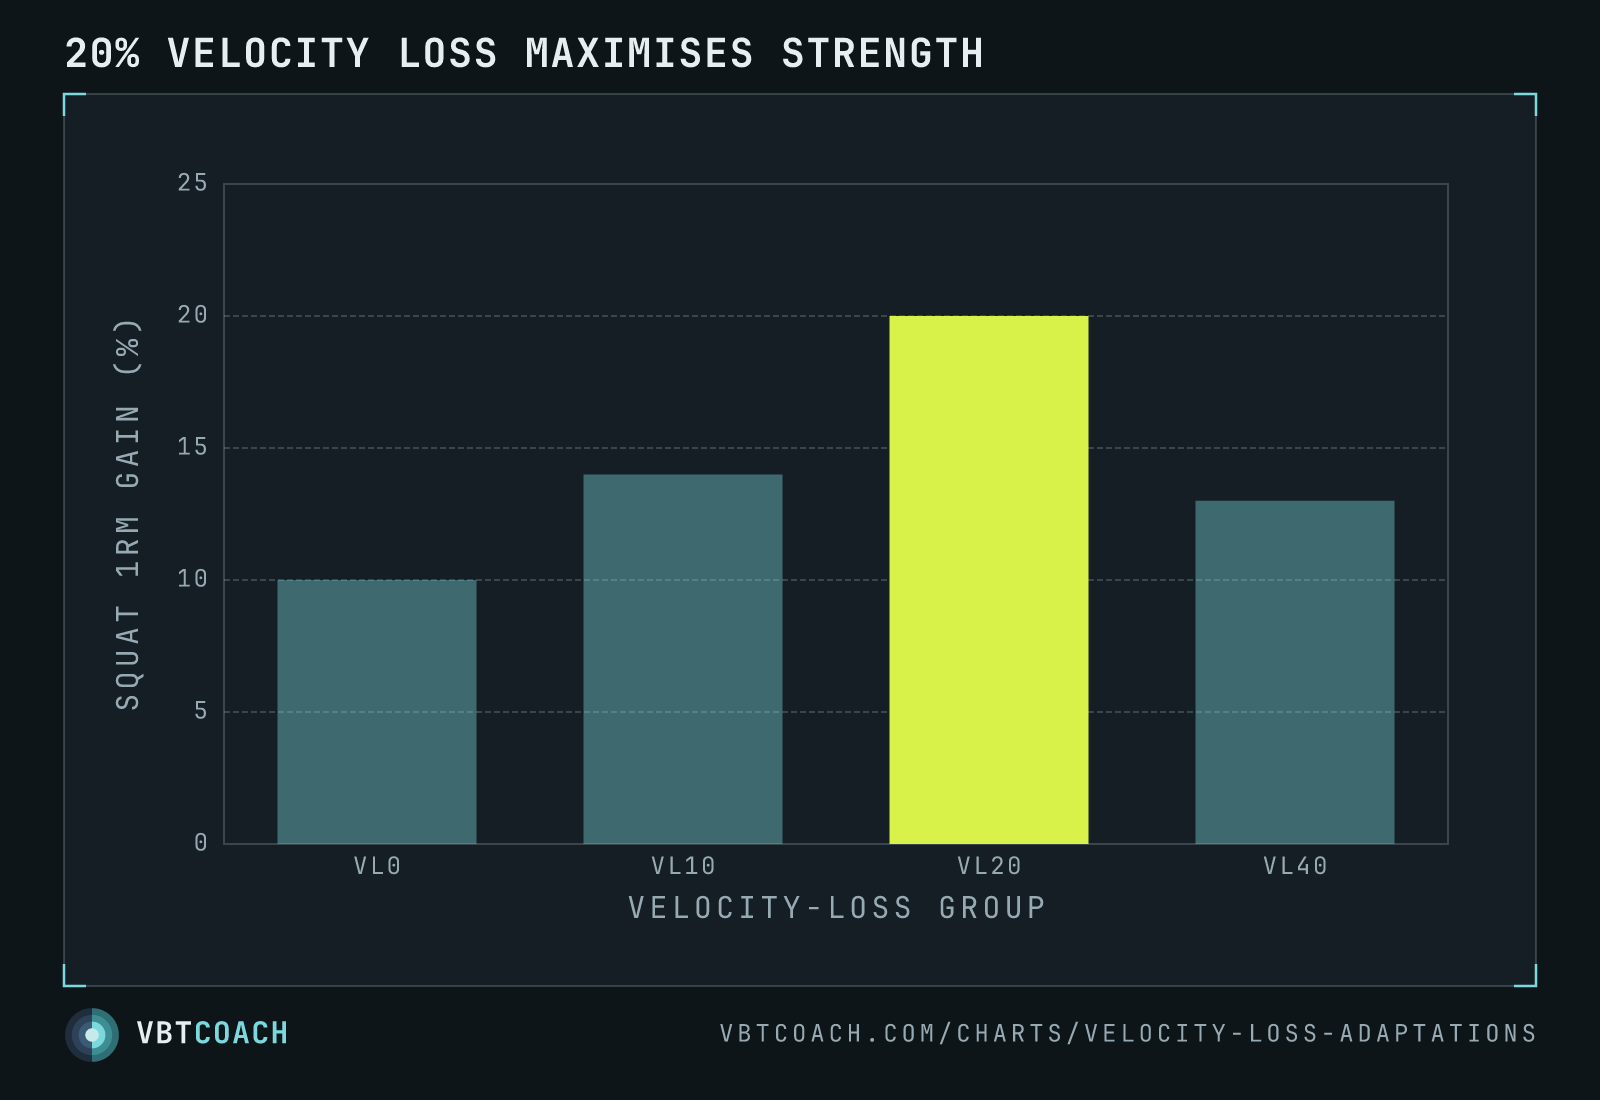
Pareja-Blanco 2017 — Strength gains peak around 20% velocity loss
Pareja-Blanco 2017 — squat 1RM gains scale with the velocity-loss cap inside each set. Strength response peaks around 20 % v-loss, then drops as fatigue overruns adaptation.
Velocity loss inside a set is a dose dial: too little and the set under-stimulates, too much and you accumulate fatigue without proportionate adaptation. Pareja-Blanco and colleagues ran a now-canonical 4-group study comparing fixed velocity-loss thresholds (0 %, 10 %, 20 %, 40 %) on squat 1RM gains over 8 weeks. Strength gain peaks at 20 %, then drops.
How to read this chart
X-axis is the velocity-loss group — the cap at which lifters terminated each set. Y-axis is the percentage gain in squat 1RM over 8 weeks. The teal bar marks VL20, the peak strength response.
VL0 means lifters stopped before any velocity dropped — first rep only, no fatigue. VL40 means lifters kept going until bar speed had fallen 40 % from the fastest rep. Between those extremes, VL20 lands the most strength gain per session minute.
When to use it
- Picking a velocity-loss cap for strength work. Defaulting to VL20 is research-backed.
- Diagnosing under-training or over-fatigue. Stuck progress with VL0 → push toward VL10–20. Stuck with VL40 → pull back; you’re training fatigue, not adaptation.
- Programming a hypertrophy phase differently. Hypertrophy data tells a different story (more loss = more growth, up to a point); use higher v-loss caps when size is the goal.
Common variations
These numbers are from squat-specific research. Bench responses are similar in shape but smaller in magnitude. Deadlift studies are sparser and harder to interpret because deadlift v-loss accumulates differently from squat — technique drift dominates, not pure muscular fatigue.
For trained athletes, VL20 may be conservative; some research supports higher thresholds for advanced lifters. For novices, even VL10 may be enough — intent matters more than fatigue at the start of training.
Pitfalls
- Over-precision. ± 2–3 % swing in 1RM gains across these groups is within study noise. Treat the shape of the curve (peak around 20 %, drop at 40 %) as the takeaway, not the exact numbers.
- Generalising from squat-only data. Most v-loss studies use back squat. Extending the same caps to overhead lifts or single-leg work is interpretation, not evidence.
- Confusing v-loss with reps in reserve. They’re different dimensions — v-loss is a fatigue cap inside the set, RIR is an effort estimate at the end of the set.
Where to go next
For the practical guide on picking a v-loss cap by goal, see Velocity-loss guidelines for fatigue with VBT. For the per-rep view inside a single set, see the Velocity loss chart.
Download high res chart images
High-resolution PNG, 1600×1000, watermarked. Free to share, embed in slides, or print. Credit appreciated.