Velocity loss chart — auto-regulate sets by fatigue, not rep count
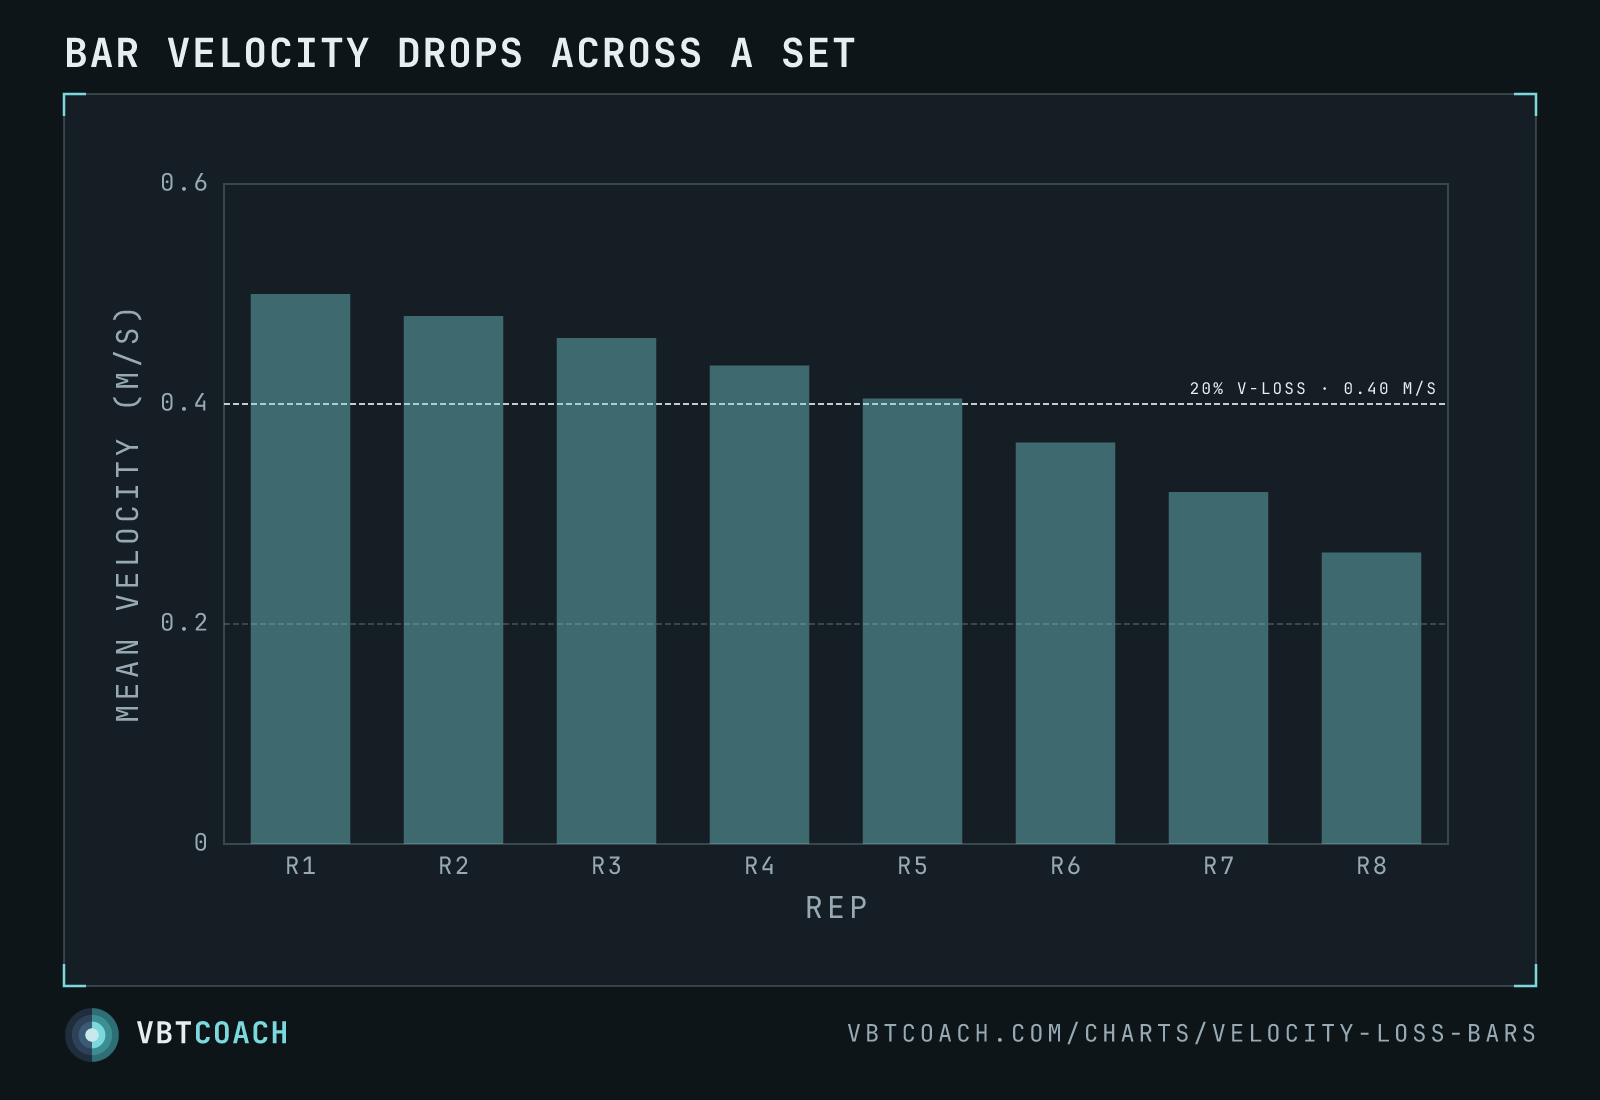
Per-rep velocity loss for a single working set. The cutoff line marks where the set should end.
Velocity loss is the cleanest single number for “how much fatigue is in this set”. It’s the percentage drop from the fastest rep (almost always rep 1) to the current rep. Cross a chosen cutoff and you rack the bar — regardless of how many reps you’d planned.
How to read this chart
Each bar is one rep’s velocity-loss percentage relative to the fastest rep of the set. The X-axis is rep number; the Y-axis is the percent drop from the set’s peak rep. The dashed reference line is your cutoff threshold — the point at which fatigue accumulation outpaces useful adaptation. Bars under the cutoff are in the productive zone; bars past it have crossed it. The set ends on the rep that first crosses the line.
Watch the gap between bars. Small per-rep increments mean fatigue is accumulating slowly — the athlete has more rope. A jump that doubles the previous gap means the well is running out fast.
The four numbers on one set
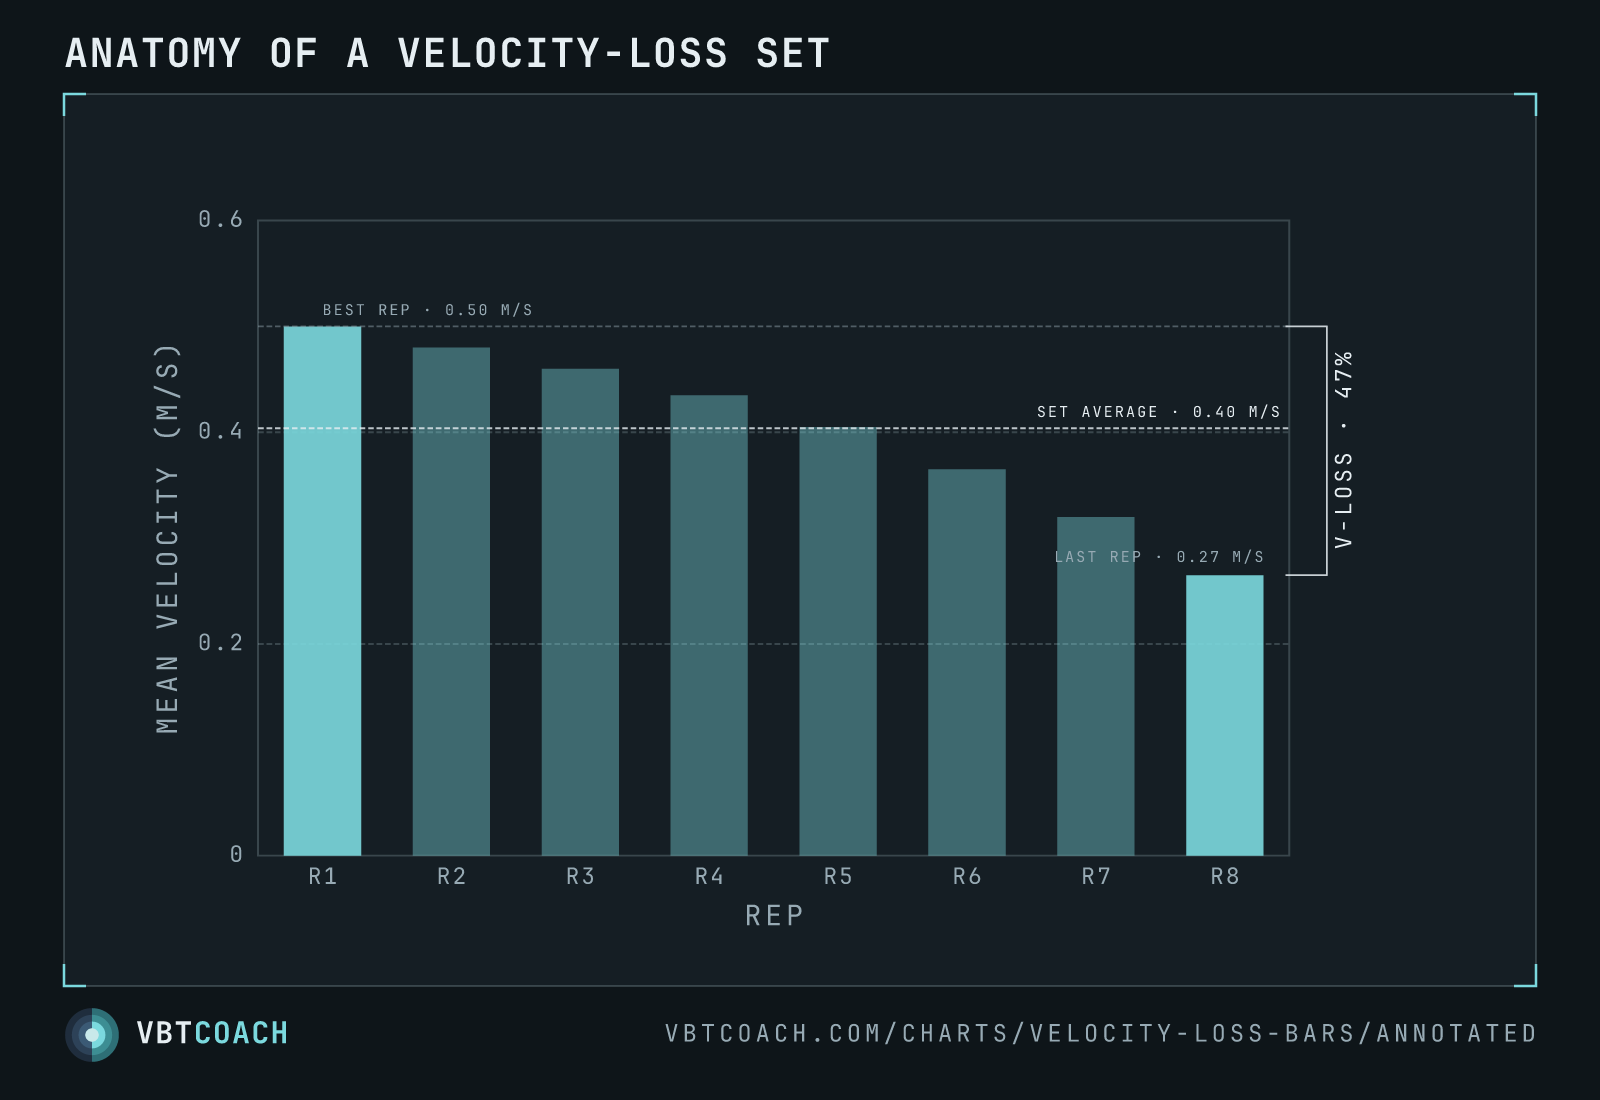
Reduce the same set to the handful of numbers a coach actually reads and they all live on this one chart:
- Best rep — the fastest rep (almost always rep 1). Everything else is measured against it, so this is the v-loss reference.
- Set average — the mean bar speed across every rep. A better summary of “how hard was the set” than any single rep.
- Last rep — the slowest rep, where the set was actually stopped.
- Velocity loss — the drop from best rep to last rep, as a percentage. This is the number the cutoff is checked against.
When to use it
- Auto-regulating inside a set. Pick a cutoff (10 %, 20 %, 30 %) based on the day’s training intent, not the program sheet. Cap volume at fatigue, not at a count.
- Comparing sets fairly. Two sets to the same v-loss target produce comparable fatigue regardless of load or rep count, so you can compare 5×5 @ 70 % to 3×8 @ 60 % without hand-wavy assumptions.
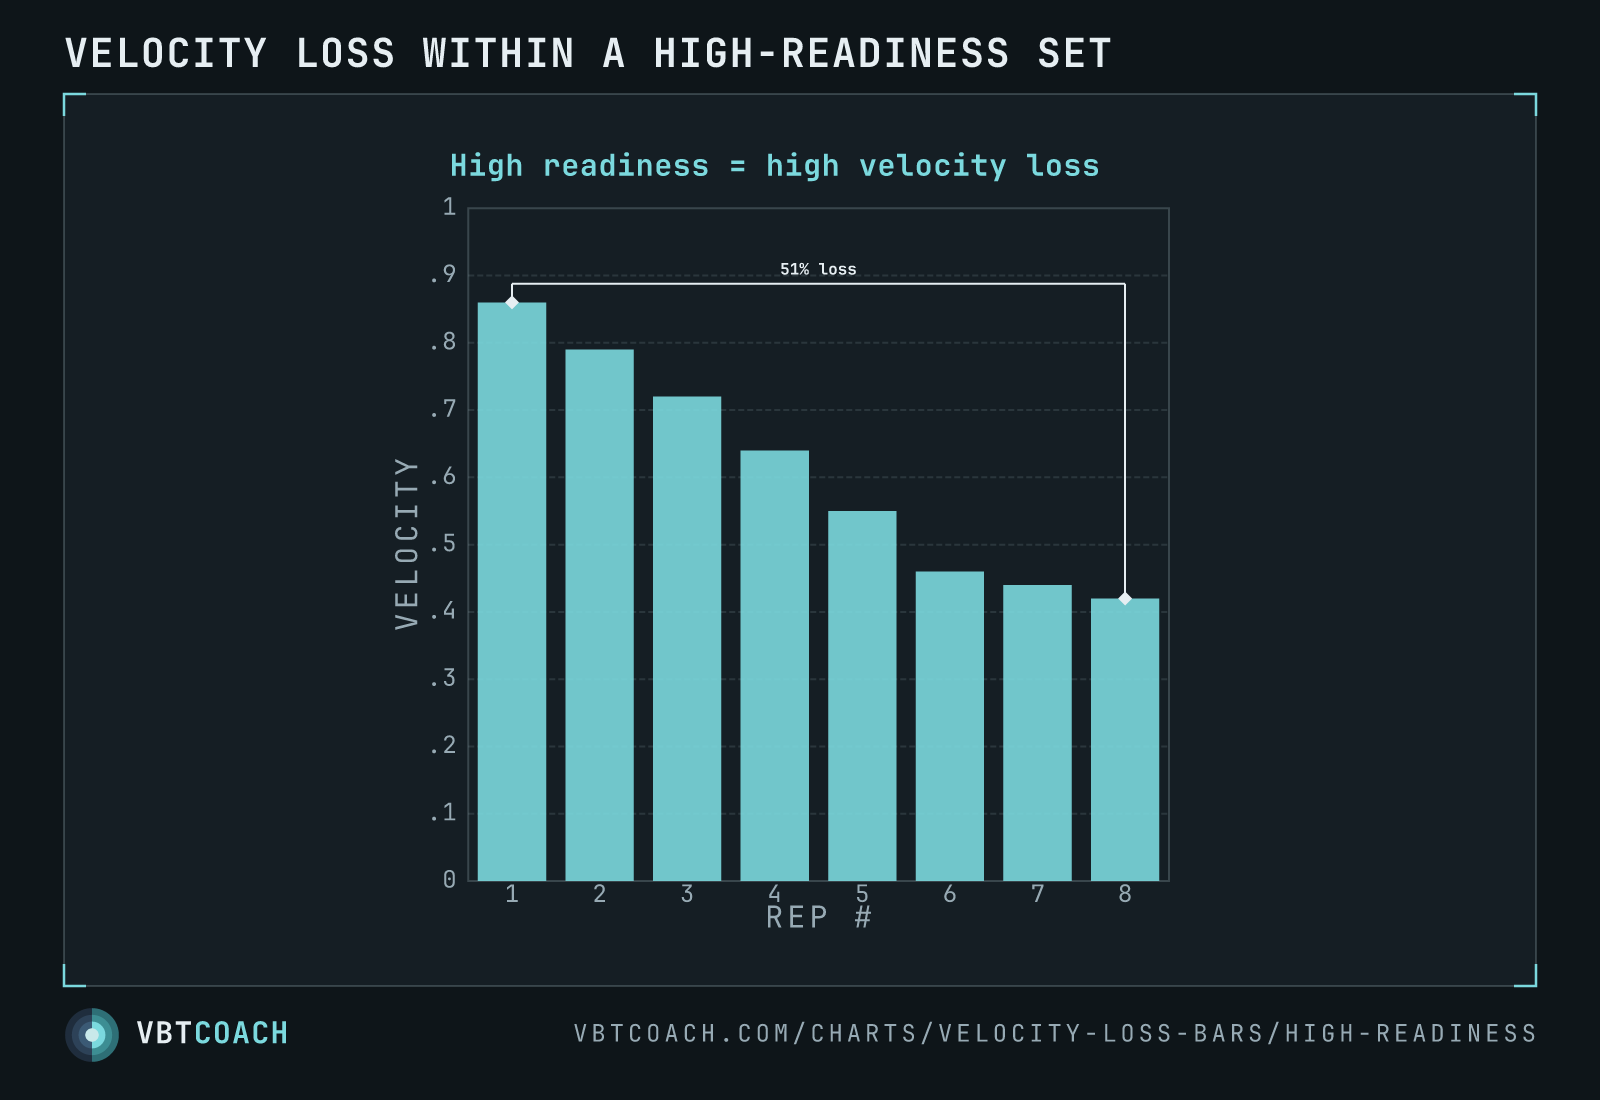
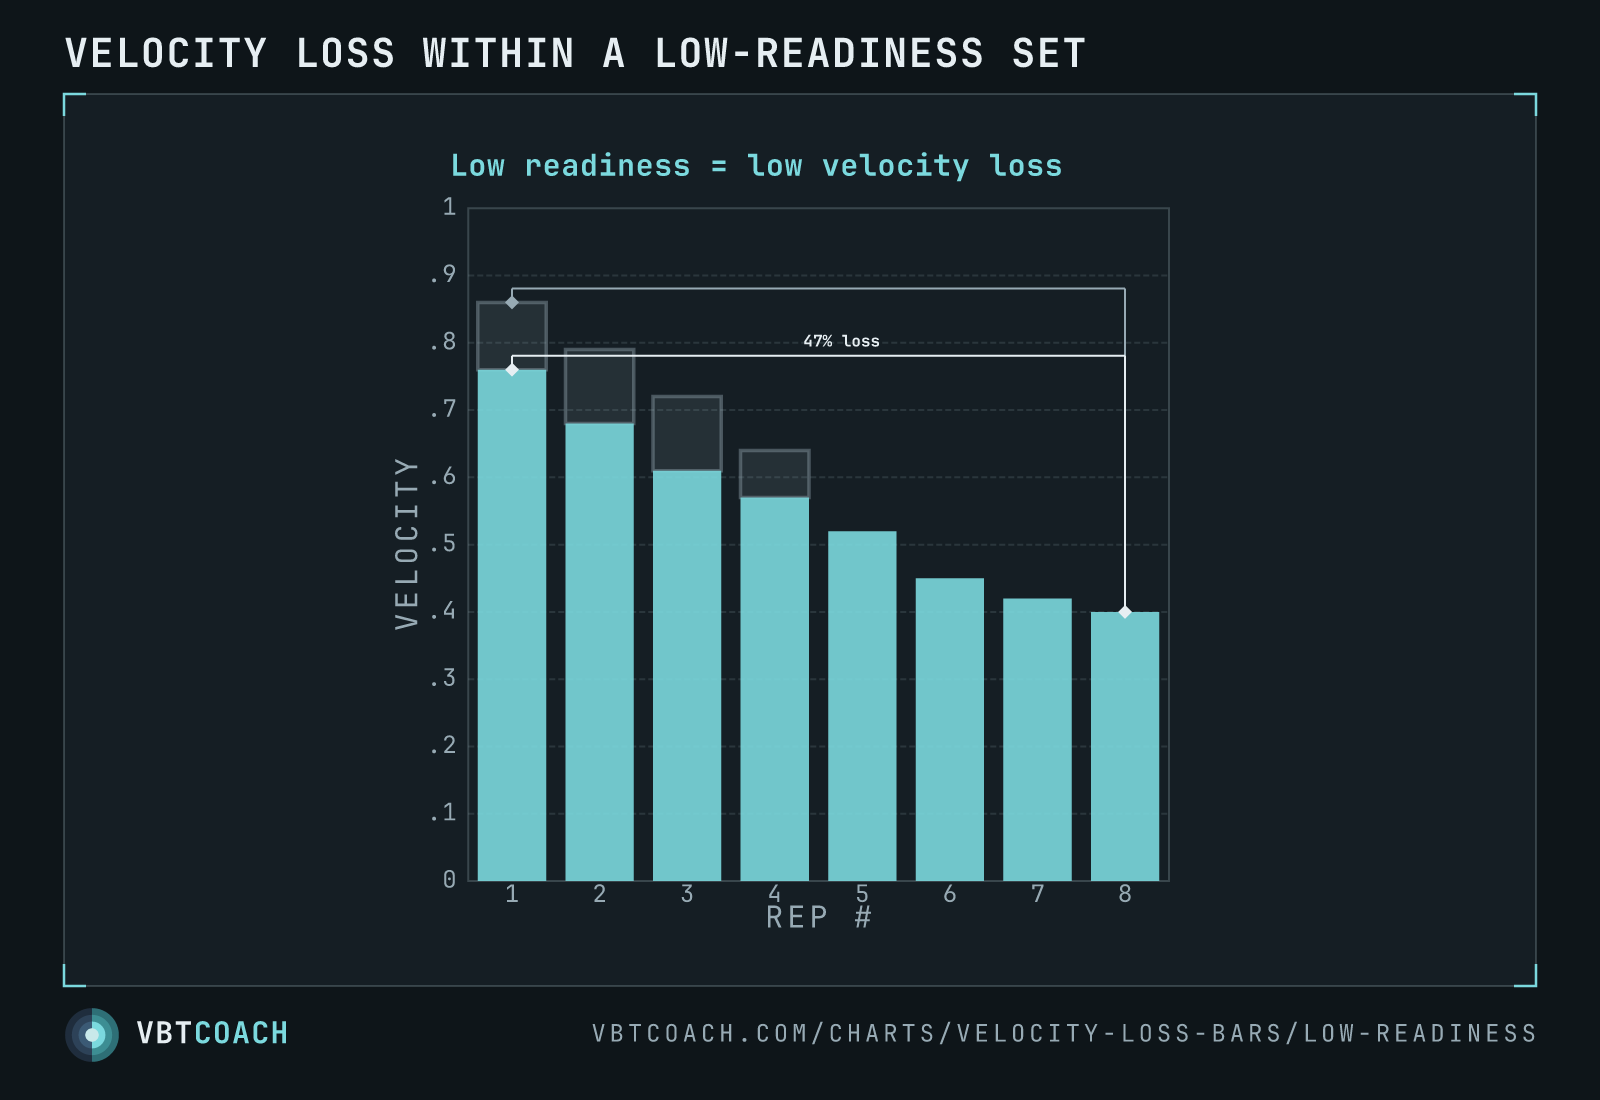
- Reading recovery. Same load + same v-loss target on Friday took two extra reps to hit vs Monday → recovery is good. Took two fewer → recovery is poor. Far cleaner than RPE for this signal.
- Calibrating new lifters. An athlete who can’t reach a 30 % v-loss target inside a set has either submaximal effort or insufficient strength endurance. Either is useful to know.
Common variations
The default cutoff in this chart is 20 % — a common pick for hypertrophy sets that prioritise mechanical tension without burying the lifter in fatigue. Strength-focused sets typically use 10 % (preserving rep quality and bar speed). Capacity / metabolite work runs 30 %+. Technique blocks sit at 5 % — a single noticeably slow rep ends the set. Curves vary by lift too: bench typically loses velocity faster than squat at the same percentage of 1RM, which means the same v-loss cutoff caps fewer reps on bench.
Pitfalls
- Reading the wrong baseline. “Fastest rep” must be the fastest concentric — not a noisy first rep that includes pre-rep movement. Modern devices filter this; eyeballed comparisons rarely.
- Working too close to a true 1RM. At very high % 1RM the first rep is already slow, so a 20 % loss happens fast and the set ends at one or two reps. The chart still works, but the cutoff choice needs to climb with intensity.
- Treating cutoffs as exact. Day-to-day v-loss is noisy. A single set ending at 22 % when targeting 20 % is fine; chasing exactness invites overinterpretation.
Where to go next
For the underlying concept, see Velocity loss. For data on how cutoffs translate into longitudinal adaptation, Velocity loss guidelines for fatigue with velocity-based training walks through the research. The Load–velocity profile chart handles the across-cycle complement: how to dose intensity from week to week.
Download high res chart images
Every chart on this page as a high-resolution PNG — 4 exports, 1600×1000, watermarked. Free to share, embed in slides, or print. Credit appreciated.