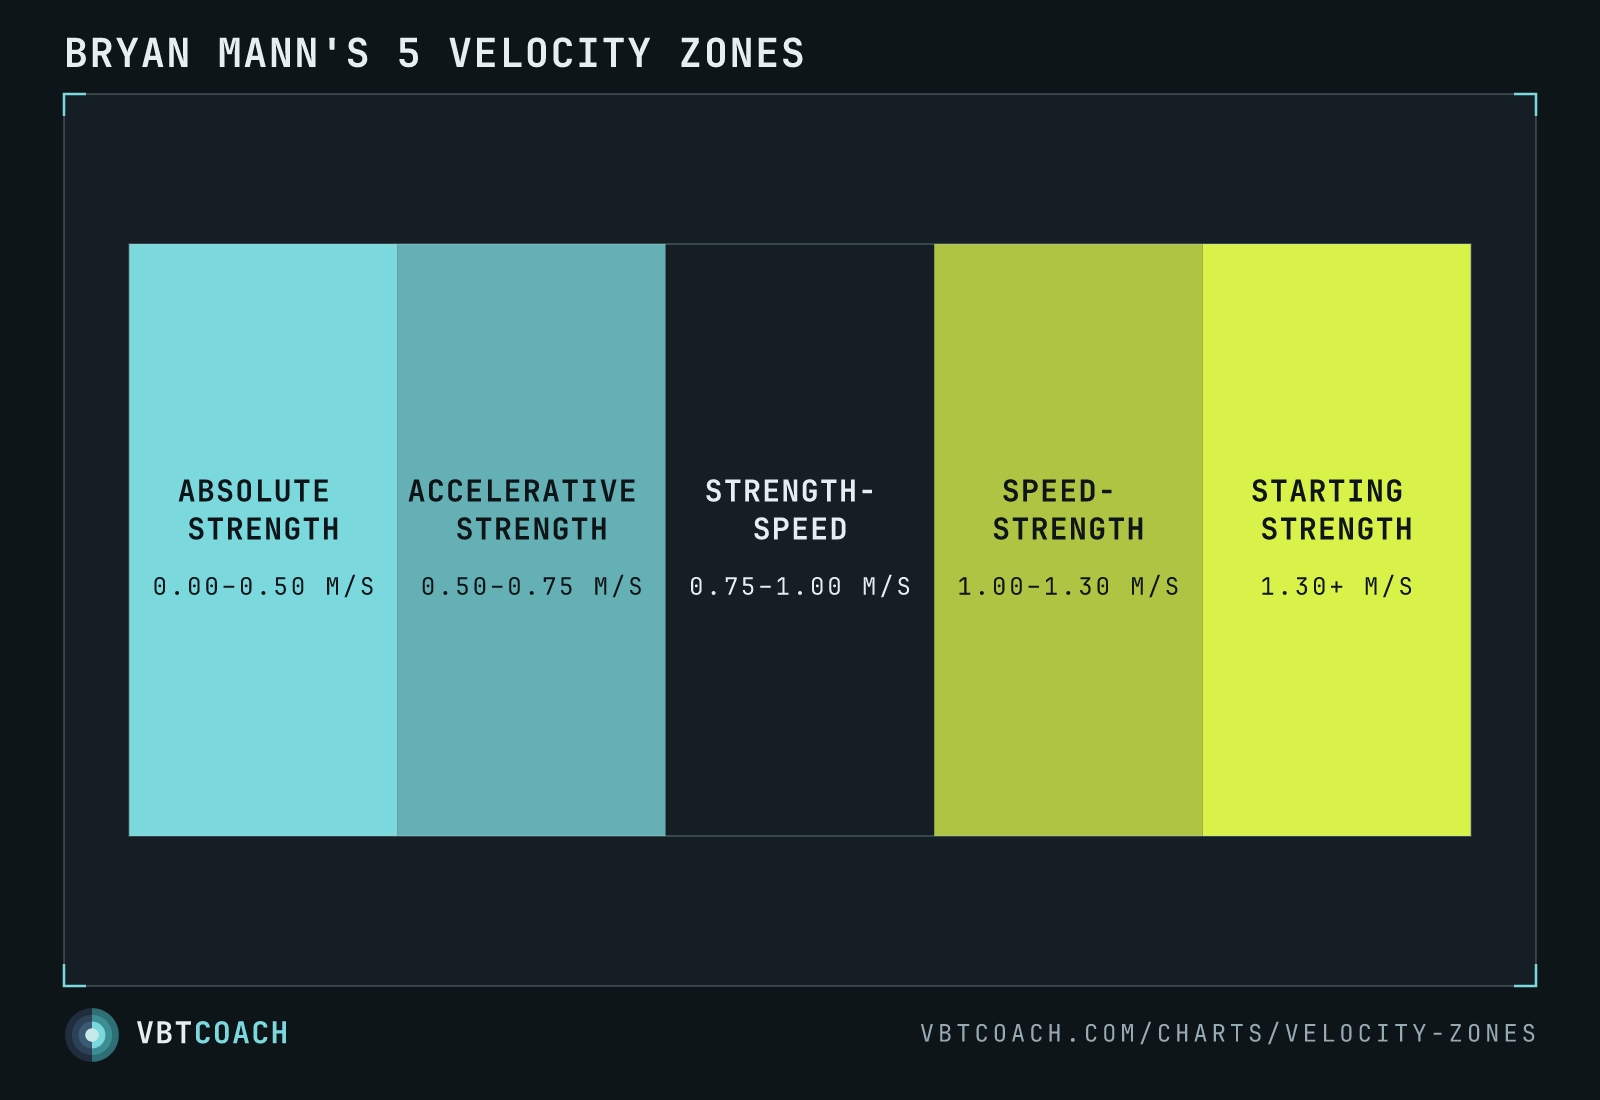
Velocity zones chart — Bryan Mann's 5-zone VBT model from absolute strength to starting strength
The canonical 5-zone velocity model. Mean concentric bar speed maps to a dominant training quality across the 0.00–2.00 m/s range.
Bryan Mann’s 5-zone model splits bar speed into named training qualities. Drop a working set’s mean concentric velocity onto this band and you have a one-shot answer to “what did I just train?” The model is canonical in VBT — it’s also debated; this chart is the textbook version, and the topic page covers where it works and where it breaks down.
How to read this chart
Each band represents a velocity range and its associated dominant training quality. Absolute strength sits at the heaviest end (≤ 0.50 m/s) — true grinding work. Accelerative (0.50–0.75) is heavy with intent. Strength-speed (0.75–1.00) sits in the peak-power region for most lifts. Speed-strength (1.00–1.30) is light-fast, dynamic-effort territory. Starting strength (1.30+) is ballistic / unloaded movement.
The colour gradient is intentional: navy at the force end, neutral in the middle, bright teal at the speed end. High force ↔ low velocity at one side, low force ↔ high velocity at the other.
When to use it
- Tagging a working set. Read off the mean concentric velocity, drop it onto this scale, and you’ve named the quality you trained.
- Programming session intent. “We need a strength-speed day” → load that gives 0.75–1.00 m/s on the working sets.
- Auditing a training block. Total minutes spent in each zone tells you what the block actually was, regardless of what the program sheet said.
Common variations
Mann’s zones were derived from squat data; they shift for bench (~0.05 m/s slower at every zone boundary), and shift more for deadlift. The fixed boundaries also assume mean concentric velocity from a reliable device — peak velocity is faster, propulsive velocity faster still, so model + measurement type must match.
Some coaches use 4-zone or 7-zone variants. The 5-zone model is what most published research and software defaults to, so it’s the lingua franca even where it isn’t the right tool for a specific lift.
Pitfalls
- Treating zone boundaries as hard cutoffs. The transitions are continuous; a working set at 0.74 m/s isn’t substantively different from one at 0.76 m/s.
- Using on a lift the model wasn’t fit on. Apply with caution to overhead press, single-leg, and Olympic variants.
- Mistaking “starting strength” for sport-specific power. The 1.30+ zone trains a quality, but actual sport movements (sprinting, jumping) involve mechanics the bar doesn’t capture.
Where to go next
For the deeper critique of the 5-zone model and a re-imagined alternative, see Velocity zones part 2 and Velocity zones part 4. For “what zone am I in right now?” against your own data, the Load–velocity profile chart tells you which load lands you in which zone.
Download high res chart images
High-resolution PNG, 1600×1000, watermarked. Free to share, embed in slides, or print. Credit appreciated.