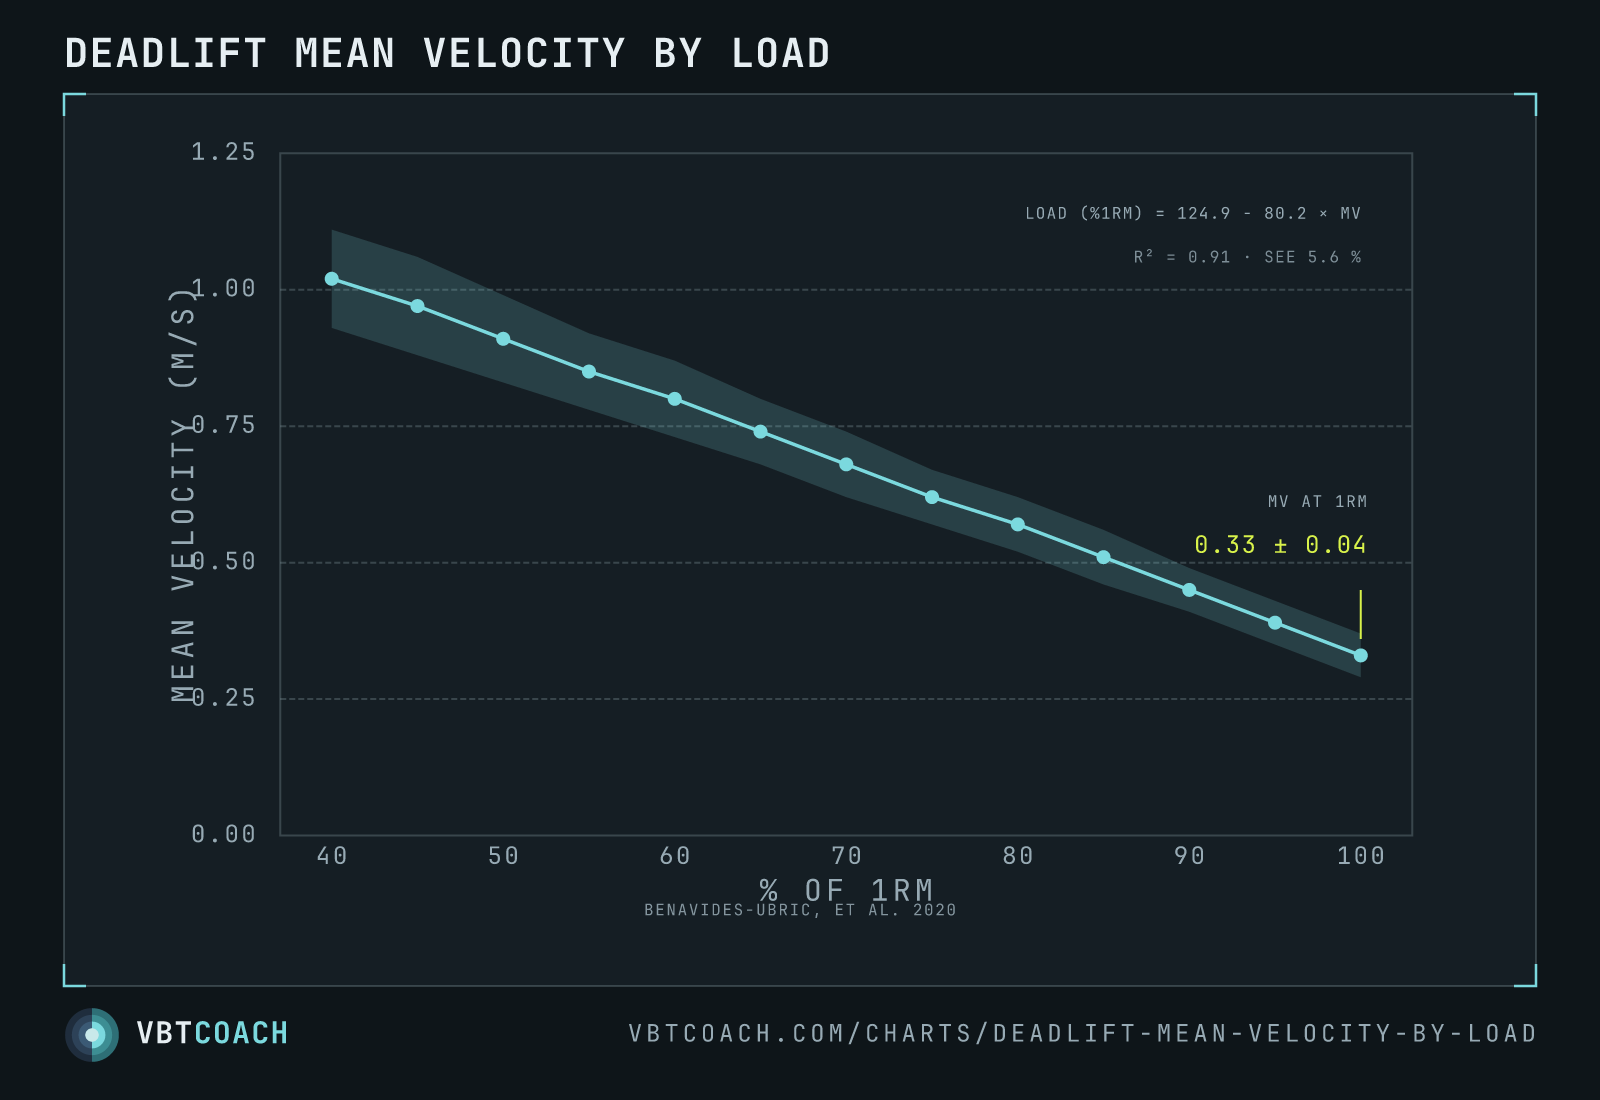
Deadlift load–velocity chart — mean bar speed at every % of 1RM in 50 trained men
Benavides-Ubric 2020 — mean concentric velocity at every 5 % of 1RM in the deadlift, from 50 resistance-trained men. The group profile with a ±1 SD band, and 0.33 ± 0.04 m/s on a true 1RM.
Most published load–velocity data comes from the squat or the bench. This is the deadlift, and it is the biggest cohort on the lift — 50 resistance-trained men, every load from 40 % of 1RM to a true 1RM in 5 % steps.
The line is the group mean. The shaded band is ±1 standard deviation, which is a deliberate choice: a 95 % confidence interval on n = 50 would be about seven times narrower and would imply a precision this data doesn’t have. The band is where roughly two-thirds of lifters actually landed.
How to read it
Pick a load on the x-axis and the line gives you the expected bar speed. At 80 % of 1RM that’s 0.57 m/s, with two-thirds of lifters between 0.52 and 0.62 — and a third outside even that. The chart is a starting point for a lifter you haven’t profiled yet, not a target to hold someone to.
Running it the other way — velocity in, load out — is what the study’s prediction equation does:
Load (%1RM) = 124.9 − 80.2 × MV (R² = 0.91, SEE 5.6 %)
That standard error is the honest part. A 5.6 % error on a 200 kg deadlift is ±11 kg, which is why the authors found individualised equations (R² ≈ 0.97) clearly beat the group equation. Use the group line to place a lifter roughly; build their own profile to place them properly.
The band narrows as the bar gets heavy
Read the width of the band from left to right. The SD falls from 0.09 m/s at 40 % 1RM to 0.04 m/s at the 1RM — heavy loads pin velocity down, light loads don’t. Two consequences:
- Profile with heavy sets. 1RM predictions built from submaximal sets closer to the max are more accurate, because there’s less spread in the data feeding the regression. The same pattern shows up in sets to failure and in every LV validity study.
- Light-load velocity targets are loose. At 40–50 % of 1RM the spread is wide enough that a prescribed speed means very different relative loads for different lifters.
The 1RM anchor
Mean velocity on a true deadlift 1RM came out at 0.33 ± 0.04 m/s. That’s the number most often lifted out of this paper and used as a deadlift minimum velocity threshold.
Treat it as a population starting point. The same study re-tested after six weeks and found velocity at 1RM only moderately stable within a lifter (ICC 0.763, CV 9.4 %) — better than the 15.7 % that Ruf et al. reported in a smaller deadlift cohort, but still not a constant you can build a max on. Capture your own on a real 1RM attempt at least once a year.
Where to go next
For the concept behind all of this, see the load–velocity profiling guide. To build your own line instead of borrowing this one, use the load–velocity profile generator or read 1RM and velocity-based training: a complete guide.
Download high res chart images
High-resolution PNG, 1600×1000, watermarked. Free to share, embed in slides, or print. Credit appreciated.