Fatigue costs you more rate of force development than max force
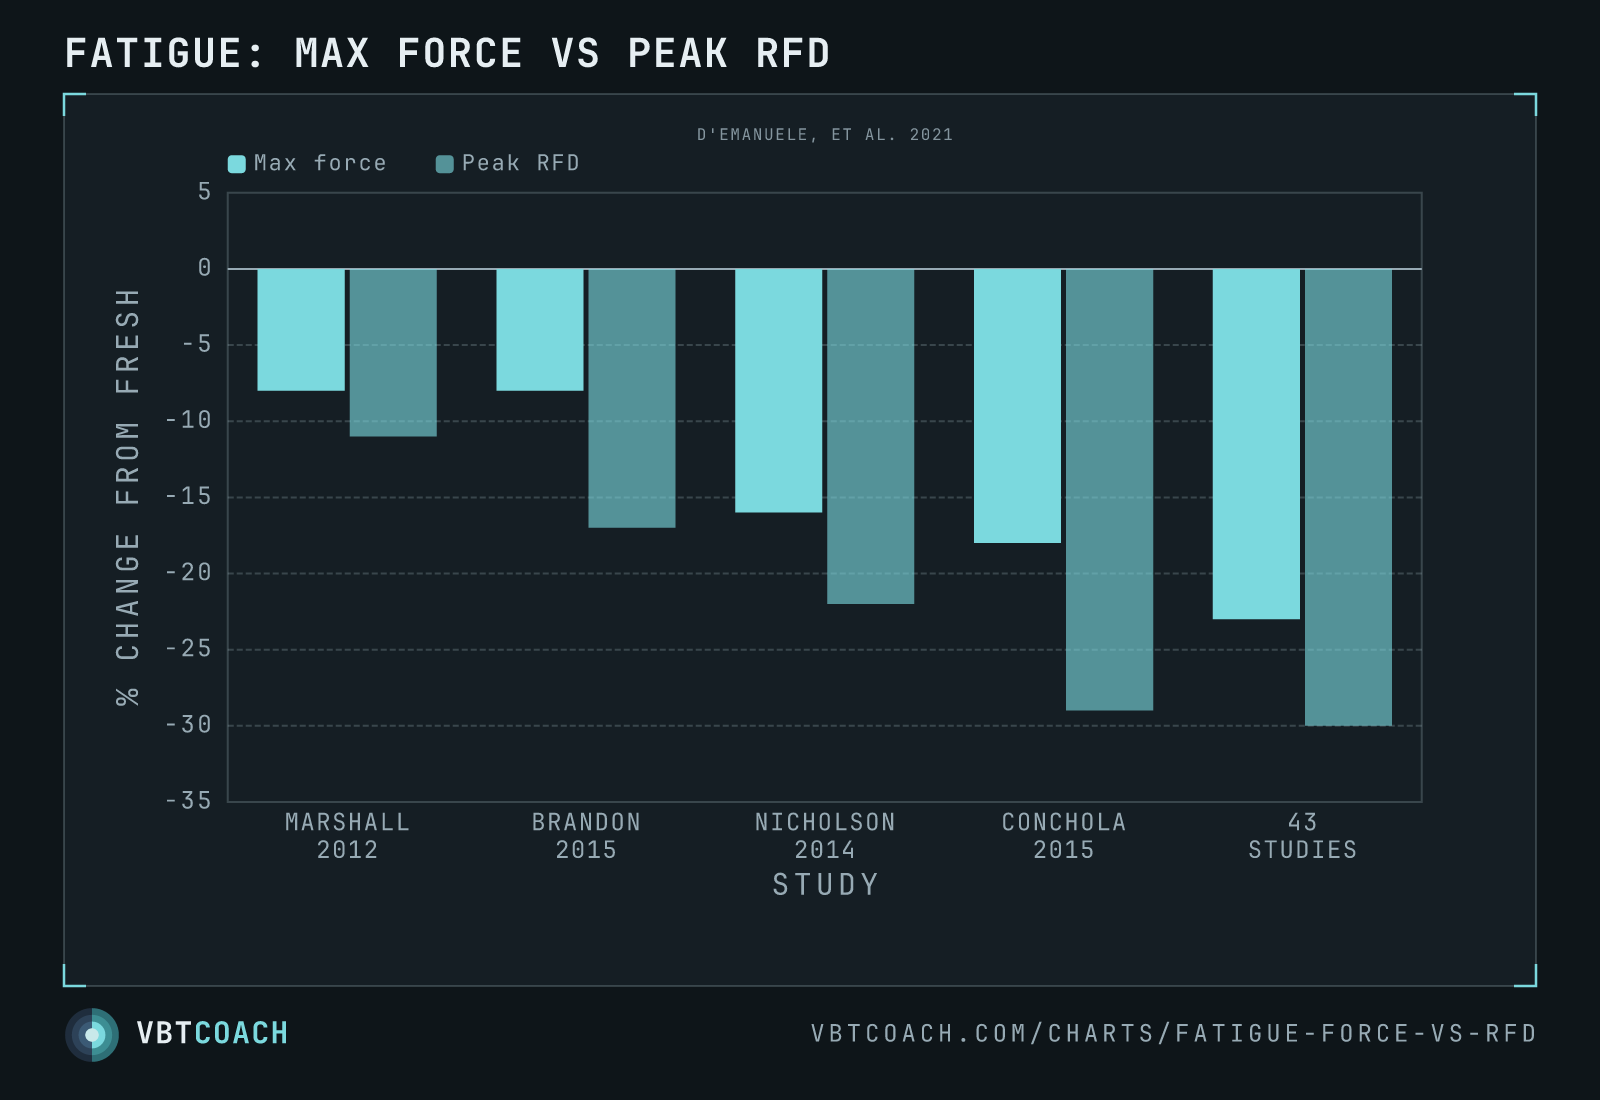
D'Emanuele et al. 2021 — across four individual studies and 43 pooled strength studies, fatigue cuts peak rate of force development further than it cuts maximal force. Max force −8 % to −23 %, peak RFD −11 % to −30 %.
Fatigue does not degrade every quality at the same rate. D’Emanuele et al.’s 2021 systematic review lined up maximal force against peak rate of force development in the same fatigued athletes, and the RFD bar is longer in every single dataset. You lose the speed of force production before you lose the force itself.
How to read this chart
Five datasets across the bottom — four individual studies, then the pooled result from all 43 strength studies in the review. Both bars hang below the zero line because both numbers are losses: percentage change from the fresh, pre-fatigue measurement.
The darker bar is maximal force. The lighter bar is peak RFD. Read the gap between them, not just the depth of either:
| Dataset | Max force | Peak RFD | Gap |
|---|---|---|---|
| Marshall et al. 2012 | −8 % | −11 % | 3 pts |
| Brandon et al. 2015 | −8 % | −17 % | 9 pts |
| Nicholson et al. 2014 | −16 % | −22 % | 6 pts |
| Conchola et al. 2015 | −18 % | −29 % | 11 pts |
| All 43 strength studies | −23 % | −30 % | 7 pts |
The direction never flips. Every dataset loses more RFD than force, and the pooled result — the most reliable number on the chart — puts the penalty at roughly 30 % of peak RFD against 23 % of max force.
Why this matters for programming
- A 1RM test underestimates fatigue. If an athlete can still grind out their heavy single, that tells you max force survived. It says nothing about the explosive quality you actually train on power days — which may already be down 30 %.
- Power work needs to sit early. Fatigue-sensitive qualities go first in a session and first in a week. Putting jumps and Olympic derivatives after a hard strength block trains them in a state where the target quality is measurably absent.
- Velocity loss is the practical proxy. You can’t measure RFD on a gym floor with a barbell, but bar speed on a light load tracks the same underlying quality. A slow first rep on a submaximal load is the RFD deficit showing up in a number you can read.
- In-season, protect RFD not the 1RM. For most sports the RFD end of the curve is the transferable end. Programming that keeps max force intact while burning 30 % of peak RFD has traded the wrong way round.
Why RFD falls further
Maximal force is largely a question of how much muscle you can recruit given enough time — a couple of hundred milliseconds is plenty. RFD is a question of how fast you can get there, which depends on motor unit firing rate, discharge synchronisation, and the state of the high-threshold units that fatigue first.
Peripheral fatigue blunts contractile speed; central fatigue lowers firing frequency. Both hit the early portion of the force–time curve hardest, and RFD is measured entirely in that early portion. Max force gets to use the whole curve, so it has room to compensate.
Pitfalls
- RFD measurement is noisy. Peak RFD is a derivative, so it amplifies signal noise, and the reported value shifts with the time window used (0–50 ms behaves nothing like 0–200 ms). Part of the spread between these studies is protocol, not physiology.
- “Fatigue” isn’t one thing. The review pools protocols ranging from a few sets to failure through to full training sessions. The consistent finding is the direction of the gap, not the exact percentage.
- Individual studies are small. Marshall’s 3-point gap and Conchola’s 11-point gap describe different protocols in different populations. Trust the pooled bar.
Where to go next
For the practical version of this — how much fatigue a set has actually bought and when to stop — see velocity loss thresholds: fatigue percentage guidelines for VBT and the velocity loss guidelines table. For which metrics degrade first inside a single set, see velocity loss across multiple metrics. The conceptual background sits on the power topic page.
Download high res chart images
High-resolution PNG, 1600×1000, watermarked. Free to share, embed in slides, or print. Credit appreciated.