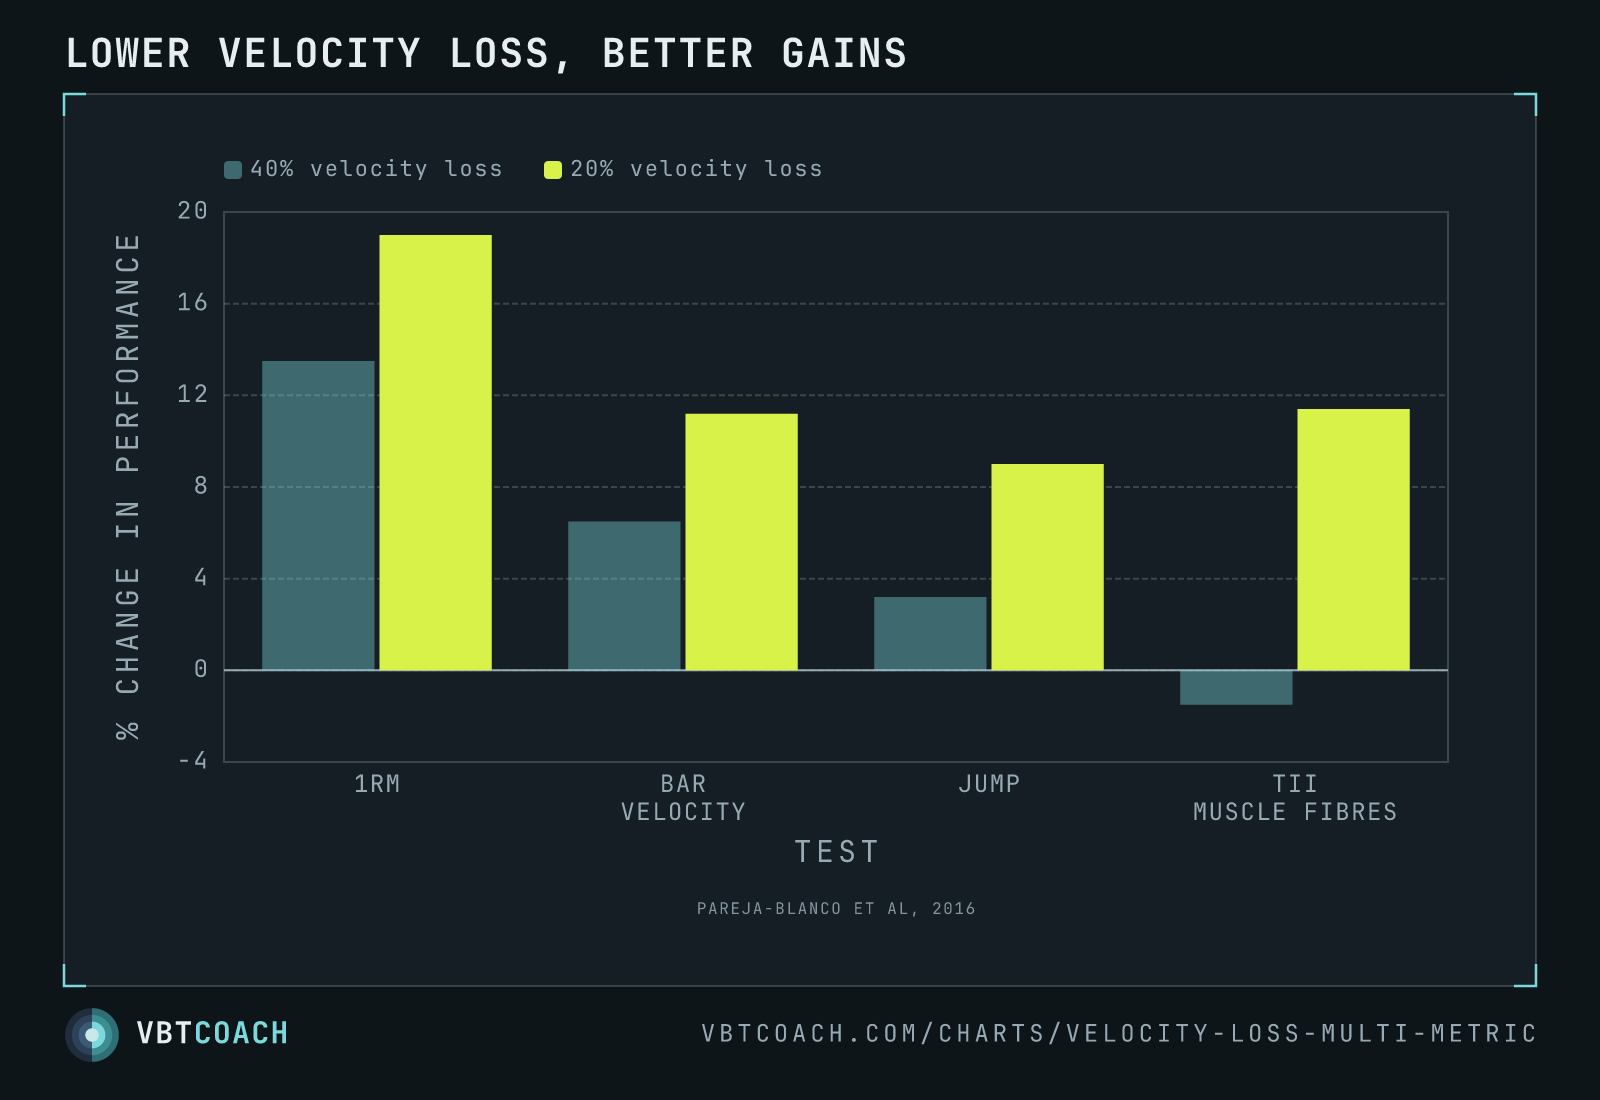
Pareja-Blanco 2017 — 20 % v-loss out-gains 40 % across strength, power, and fibre type
Pareja-Blanco 2017 — training to 20 % velocity loss out-gained 40 % on 1RM, bar velocity, jump, and type-II muscle fibres, while doing significantly less total volume.
Pareja-Blanco’s 2017 study took the velocity-loss-cap concept past the simple ”% gain in 1RM” comparison and tested four outcome measures across two cap levels: 20 % and 40 %. The 20 % group won every measure — including type-II muscle fibre cross-sectional area, the metric you’d most expect to favour the higher-volume 40 % group. They did it with substantially less total work.
How to read this chart
Four outcome measures across the bottom: 1RM, bar velocity, countermovement jump, and type-II muscle fibre cross-sectional area. Navy bars are the 40 % velocity-loss group, teal bars are the 20 % group. The y-axis is percent change from baseline.
Every metric favours the 20 % group. The 1RM gap is moderate (~5 percentage points) but consistent. The bar-velocity and jump gaps are bigger — the 40 % group barely improved jumps. The type-II muscle fibre gap is the most surprising: the lower-volume 20 % group grew their fast-twitch fibres while the higher-volume 40 % group lost a small amount.
When to use this evidence
- Picking a velocity-loss cap. The literature has converged on 20 % as a sensible default for strength-and-power-oriented training. This chart is one of the canonical reasons.
- Defending lower-volume programming to a sceptical coach or lifter. “More work” doesn’t mean “more progress” once fatigue overruns adaptation. The 20 % group did less per session and gained more.
- Programming for sport athletes. The jump and type-II findings are the ones that matter for athletic performance. The 40 % group was actively backsliding on the metrics most relevant to sport.
Why 20 % beats 40 %
Each rep past the velocity-loss cap is buying diminishing adaptation at increasing fatigue cost. By the time bar speed has dropped 40 %, the lifter is grinding through reps that recruit fewer high-threshold motor units (because fatigue has already taxed them out), produce less rate-of-force-development, and accumulate disproportionate central nervous system fatigue. The cumulative effect across 8 weeks is exactly what the chart shows: more junk volume, less effective stimulus.
The type-II finding is the clearest demonstration. Type-II fibres are the fast-twitch muscle responsible for explosive output; they’re recruited preferentially during high-velocity reps. Once velocity drops 40 %, the high-threshold fibres aren’t being meaningfully trained anymore — and over weeks they atrophy slightly from disuse, even as the lifter is technically working harder.
Pitfalls
- Population-specific. Pareja-Blanco’s sample was trained males. The optimal v-loss cap for novices may be lower (less fatigue tolerance), and the optimal for highly trained powerlifters may be higher (more fatigue resilience).
- Lift-specific. The cap was applied to back squats. Bench, deadlift, and overhead lifts all behave slightly differently — typically the cap that works on squat over-extends a session on bench.
- One paper. The 20 % vs 40 % comparison has been replicated; the exact magnitudes vary across studies. Treat the direction of the effect as robust, not the specific numbers.
Where to go next
For the simplified version of this same chart (single-metric strength gain across 4 v-loss levels), see velocity-loss adaptations. The practical guide on picking a cap by goal is velocity-loss guidelines for fatigue with VBT. For the within-session view of the same fatigue dynamics, see the velocity loss bars chart.
Download high res chart images
High-resolution PNG, 1600×1000, watermarked. Free to share, embed in slides, or print. Credit appreciated.