Velocity loss guidelines — the threshold to use for every training goal
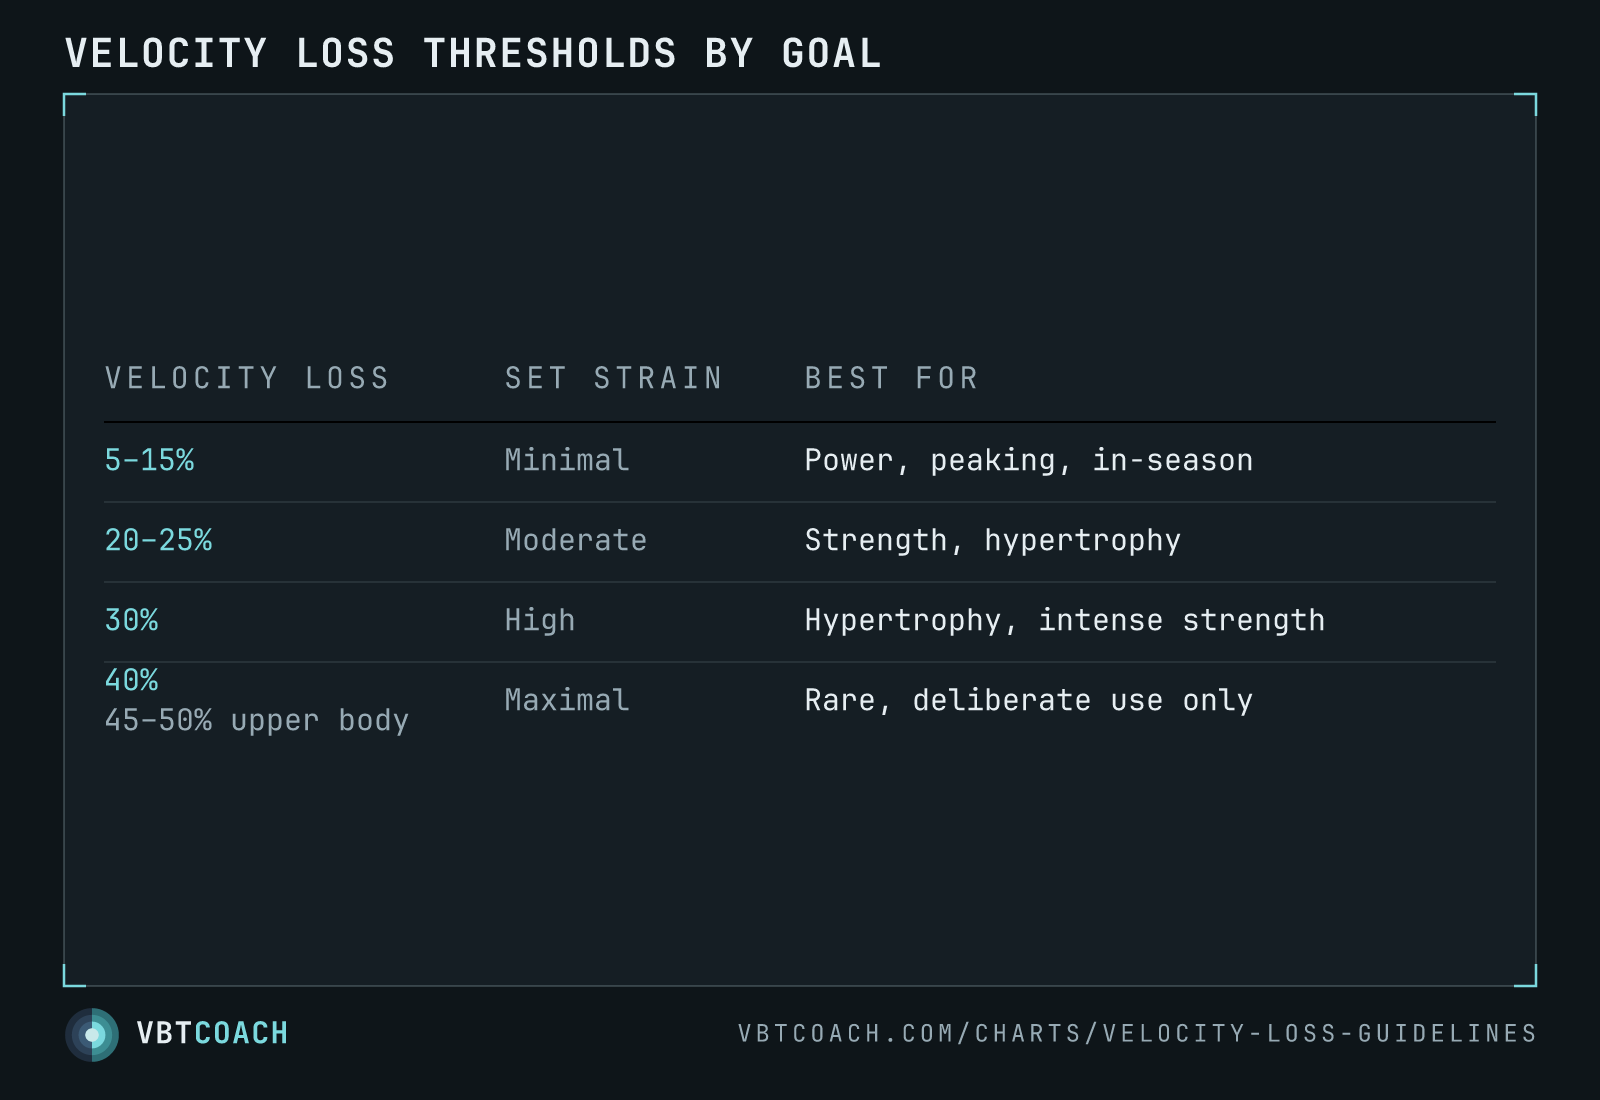
The five velocity-loss bands, how hard each one makes a set, and what each is best for — 0–10 % for power and peaking, 10–20 % for quality volume, 20–30 % for strength and hypertrophy, 30–40 % for hypertrophy blocks, 40 %+ only when failure is the point.
Every velocity-loss decision comes down to one trade: how much fatigue you’re willing to buy for the adaptation you want. This table is that trade priced out. Pick the goal, read the cutoff, program the set.
How to read this chart
Three columns. Velocity loss is the cutoff — the percentage drop from the fastest rep of the set to the rep that ends it. Set strain is what that cutoff costs you in fatigue. Best for is the adaptation the band actually buys.
The bands are not a ladder to climb. Higher isn’t more advanced, it’s just more expensive. A 30 % band in a hypertrophy block and a 10 % band in a peaking week are both correct programming; running 30 % year-round is not.
The bands are contiguous 10 % steps, so a cutoff always lands in exactly one of them. Pick the band from the goal, then pick the number inside it from the athlete — the top of a band on a fresh lifter, the bottom on a fatigued one.
Using the bands
- 0–10 % — minimal strain. Power, peaking, in-season. Keeps bar speed high and volume low. This is the taper band: hold intensity, cut reps, let supercompensation surface.
- 10–20 % — light strain. Strength, quality volume. Reps stay fast and technically clean while still accumulating work. The band to sit in when you want volume that doesn’t cost you the next session.
- 20–30 % — moderate strain. Strength and hypertrophy. Enough stimulus to force adaptation, little enough fatigue to repeat the session in 48 hours. If you only ever program one range, program this one.
- 30–40 % — high strain. Hypertrophy, intense strength. More total reps and more accumulated fatigue, which suits a block where volume is the driver and recovery is planned for. Also useful as a one-off with an athlete you suspect is sandbagging — give them 35 % and let the rep count tell the truth.
- 40 %+ — maximal strain. Rare, deliberate use only. This is training to failure with a number attached. Occasionally worth it to test a limit or finish a block; ruinous as a habit.
Pitfalls
- Thresholds assume maximal intent on every rep. A lifter pacing themselves will drift toward the cutoff slowly and rack the bar having done nothing hard. The number only measures fatigue if every rep was a genuine attempt at maximum speed.
- Low-rep heavy sets break the resolution. On sets of 1–3, velocity loss jumps in coarse steps — 15 % on rep 2, 35 % on rep 3, no useful reading in between. Use RPE in-set and read velocity loss after.
- Readiness distorts the reading. On a bad day the first rep is already slow, so a “20 %” set is deeper into real fatigue than the number suggests. See the velocity-loss set chart for what a suppressed first rep does to the reading.
Where to go next
The full method — how to measure velocity loss, why best-rep beats first-rep as the reference, and how to run stop points in a session — is in velocity loss thresholds: fatigue percentage guidelines for VBT. For what the thresholds do to adaptation over 8 weeks, see velocity loss adaptations and training to failure long-term.
Download high res chart images
High-resolution PNG, 1600×1000, watermarked. Free to share, embed in slides, or print. Credit appreciated.