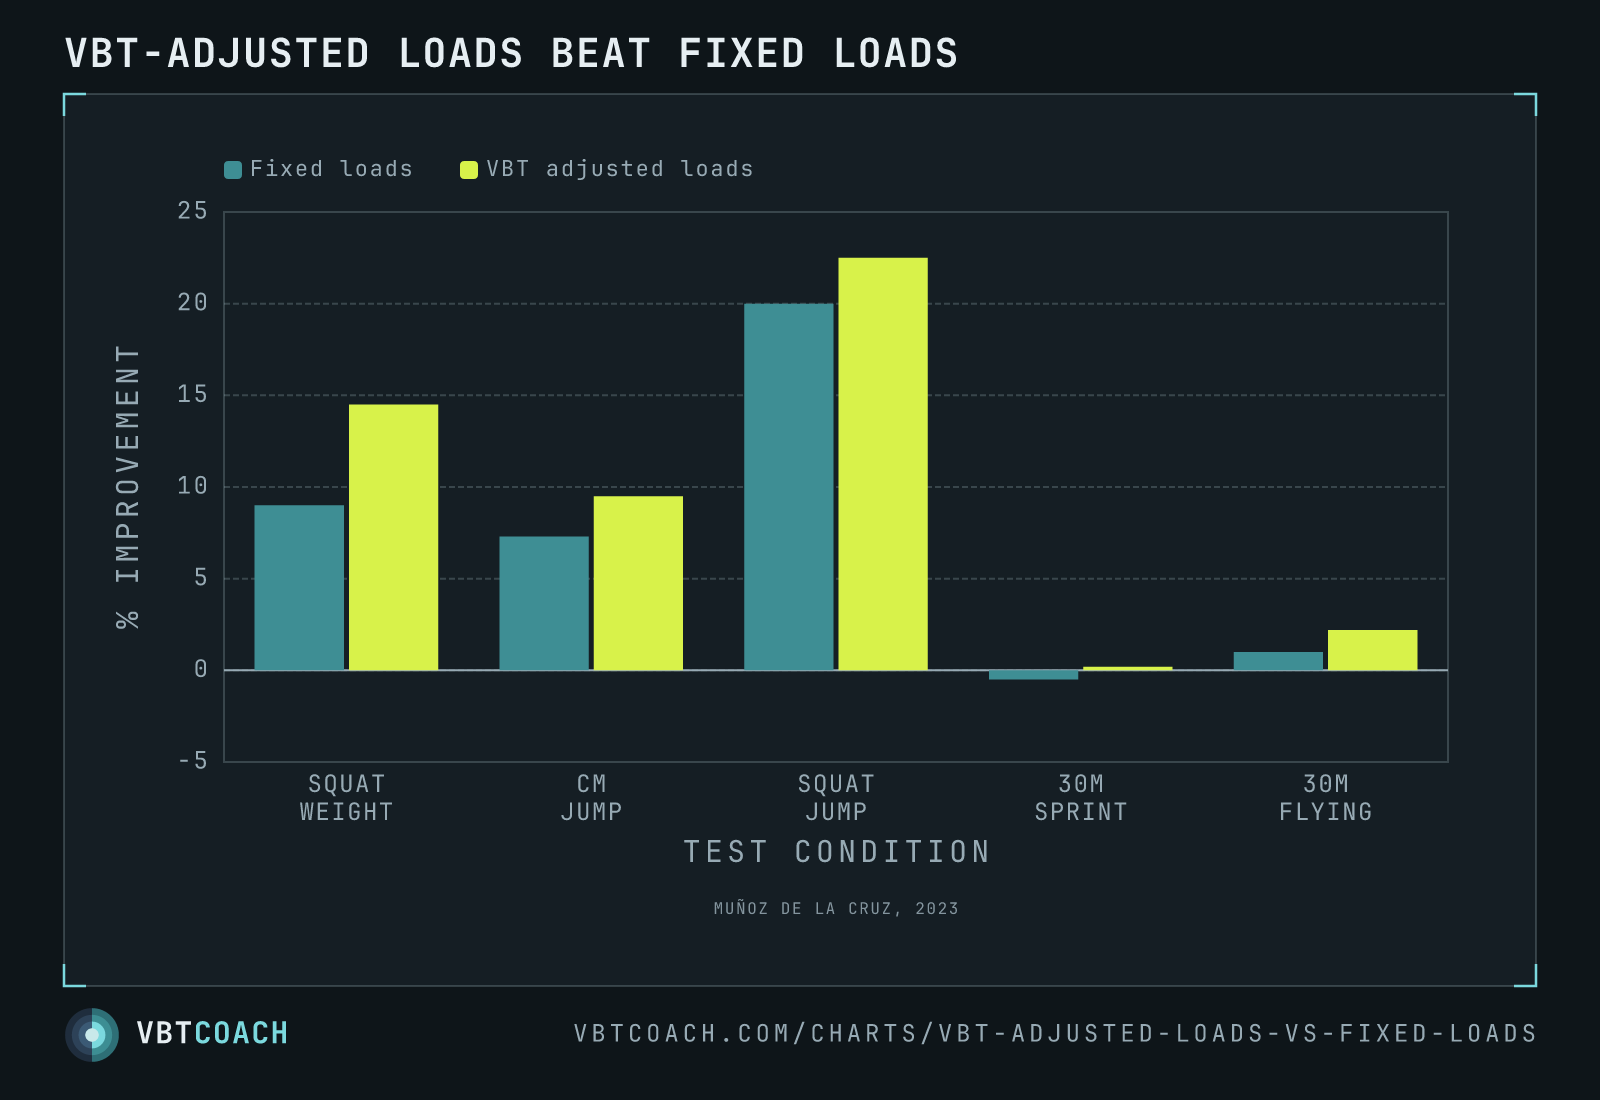
Muñoz de la Cruz 2023 — Daily VBT load adjustment beats fixed loads on every outcome
Muñoz de la Cruz 2023 — six weeks of resistance training with daily VBT-adjusted loads out-gained a fixed-load prescription on every outcome, including strength, jumps, and 30 m sprint metrics.
Muñoz de la Cruz and colleagues took two groups of experienced sprinters through six weeks of identical resistance training, with one variable changed: how loads were prescribed each day. The control group used fixed loads (typical % 1RM prescription). The intervention group used VBT to adjust each day’s loads based on bar speed. Across every outcome measured — strength, jumps, sprint — the VBT-adjusted group came out ahead.
How to read this chart
Five outcome categories across the bottom: squat 1RM, countermovement jump, squat jump, 30 m sprint, and 30 m flying sprint. Navy bars are the fixed-load group, teal bars are the VBT-adjusted group. Y-axis is percentage change in performance from baseline.
The biggest absolute gap is on squat weight (14.5 % vs 9.0 %) — VBT prescription gained ~60 % more strength than fixed loads. The 30 m sprint outcome is small but worth noticing: the fixed-load group went backwards (-0.5 %) while the adjusted group held even (+0.2 %). Sprinters can’t afford to lose top-end speed during a strength block; this chart says daily auto-regulation prevents that.
When to use this evidence
- Justifying VBT in sport-specific contexts. This study used experienced sprinters, not bodybuilders or recreational lifters. The transfer to field tests (sprint, jump) is what matters for athletic populations.
- Defending daily auto-regulation. Same exercises, same volume, same exercise order — only the day-by-day load adjustment differed. The chart isolates the auto-regulation effect.
- Programming during competition / in-season blocks. Daily readiness varies more in-season than off-season. VBT-adjusted prescription holds the relative load constant against that variability.
Why fixed loads under-perform
Fixed-load prescription assumes the athlete’s 1RM is stable across the week. It isn’t (see the daily 1RM fluctuation chart). On bad days, fixed loads land too heavy and fatigue compounds; on good days, they land too light and the stimulus is wasted. Across six weeks, those mis-prescriptions accumulate. VBT-adjusted prescription corrects for daily readiness in real time — every working set lands at the intended relative intensity regardless of how today’s nominal max would feel.
Pitfalls
- Population-specific. Experienced sprinters carry different recovery profiles, training history, and competing demands than recreational lifters or strength-sport athletes. The effect direction generalises; the magnitude likely shrinks in less-elite cohorts.
- Six-week intervention. Effect sizes this large in six weeks would partially regress over longer blocks as both groups approach physiological ceilings. The direction is robust; the size shrinks with longer studies.
- VBT requires hardware + skill. “Daily VBT-adjusted prescription” sounds clean in print but requires a measurement device, set-up time, and an athlete who knows their working velocities. Adoption cost matters; this chart shows the payoff once that cost is paid.
Where to go next
For the conceptual case underneath this finding, see the daily 1RM fluctuation chart — the day-to-day variation that fixed-load prescription can’t see. The companion comparison in trained males (not sport athletes) is the VBT vs %-based training chart (Vasiljevic 2024). For the practical “how to set up VBT-adjusted loads” guide, 1RM and VBT — a complete guide walks through the protocol.
Download high res chart images
High-resolution PNG, 1600×1000, watermarked. Free to share, embed in slides, or print. Credit appreciated.