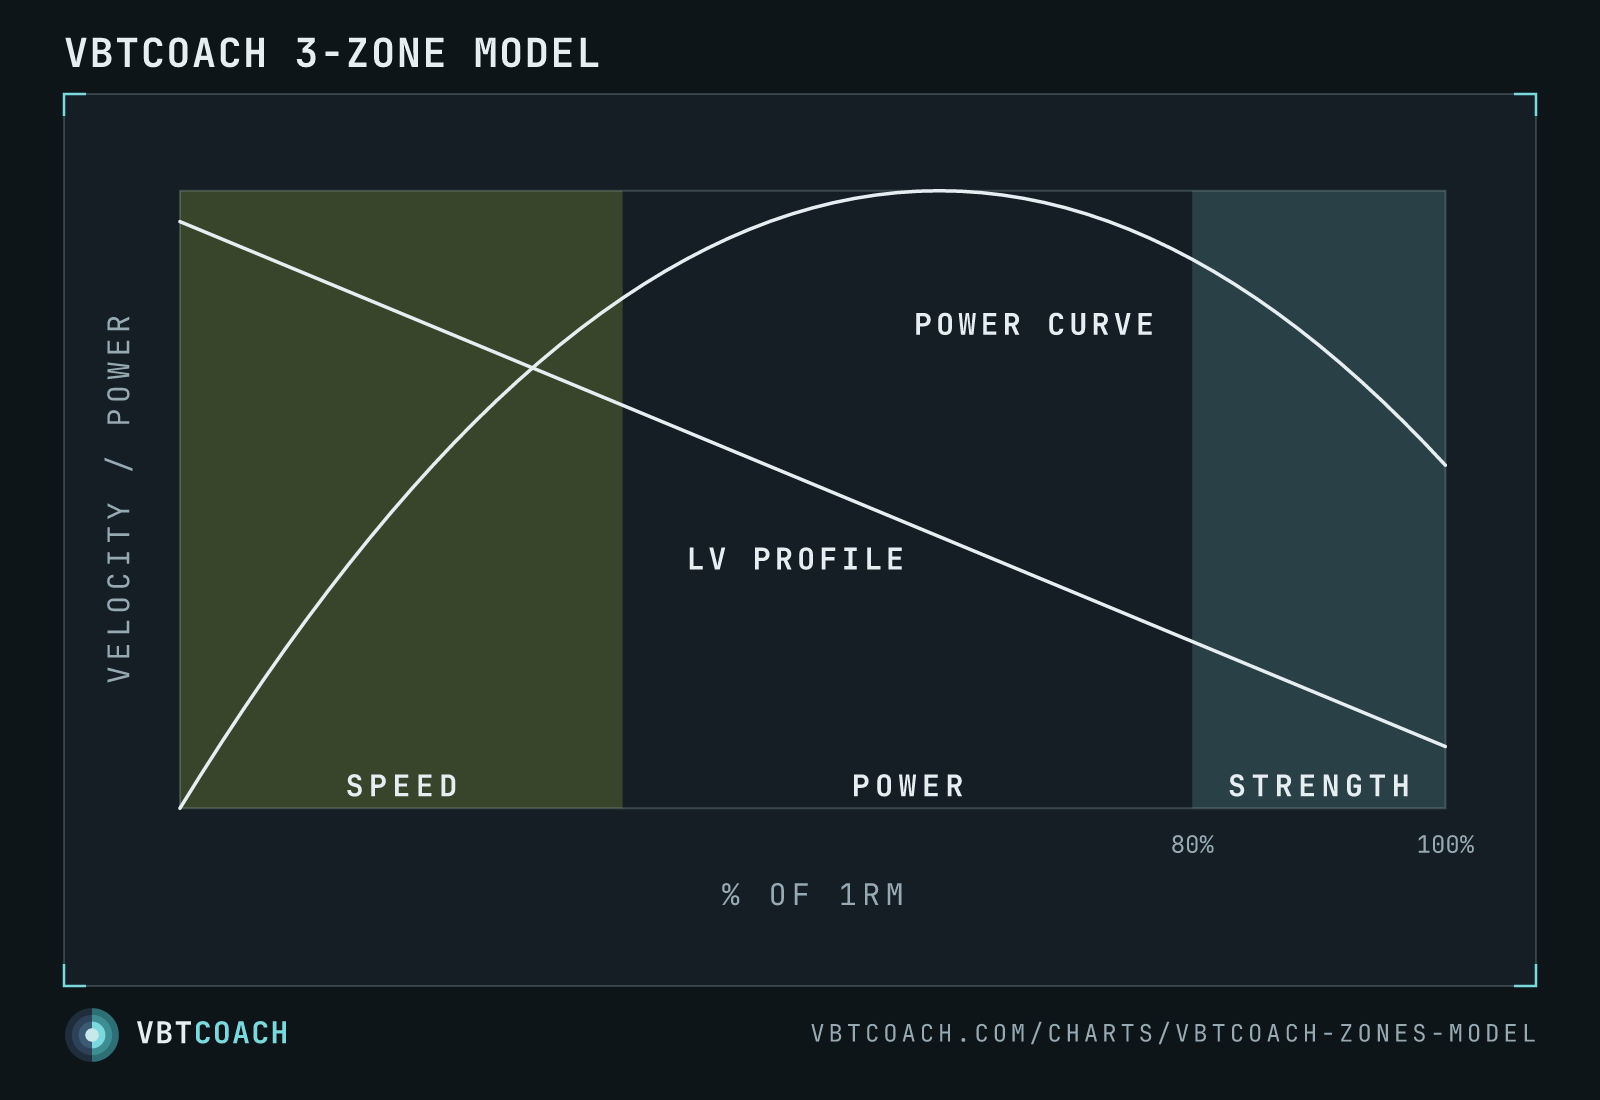
VBTcoach 3-zone velocity model — speed, power, and strength on a single % 1RM band
A simplified velocity-zone model defined on the % 1RM axis. Three load bands — Speed, Power, Strength — instead of Mann's five velocity-axis zones.
The 3-zone model collapses Mann’s 5 velocity zones into three load bands on the % 1RM axis. The trade-off is intentional: 5 zones is more granular but more brittle (the boundaries are shaky and the labels are easy to confuse), 3 zones is coarser but maps cleanly onto how coaches actually program — by load percentage, not by bar speed.
How to read this chart
X-axis is load as a percentage of 1RM. The three coloured bands are the zones:
- Speed (0–35 % 1RM) — light loads where bar velocity dominates. Trains rate of force development with minimal fatigue cost.
- Power (35–80 % 1RM) — the load × velocity intersection. Peak mechanical power lives here. The biggest, busiest zone for most lifters most of the time.
- Strength (80–100 % 1RM) — heavy loads where force production dominates. Trains absolute strength.
Two curves are overlaid on the bands as visual reference:
- LV profile — the linear bar-speed-vs-load relationship for a working lift. High velocity at low load, low velocity at heavy load.
- Power curve — the parabolic power output, peaking inside the Power zone.
The Y-axis is qualitative — both curves share it for comparison; specific units don’t matter for the model.
Why three zones instead of five
Mann’s 5-zone model lives on the velocity axis (m/s). Working coaches mostly think in load percentages (% 1RM). Translating between the two takes mental overhead each session. A model defined on the same axis the program sheet uses removes that step.
Five zones also try to label transitions that are continuous in reality. Strength-Speed at 0.85 m/s isn’t doing anything substantively different from Speed-Strength at 0.95 m/s — the labels imply discrete physiological switches that don’t exist. Three zones admit the only transitions worth naming are:
- Light enough that velocity is the goal (Speed)
- Heavy enough that force is the goal (Strength)
- The wide middle where their product matters (Power)
That’s the shape of coaching decisions, full stop. We have a longer breakdown on Velocity zones part 4.
Training modes by zone
The same three zones, with common training modes plotted as load ranges:
Most modes span more than one zone — that’s the point. Plyometrics and sprints sit almost entirely in Speed; Olympic lifts straddle Speed and Power; classic strength exercises (back squat, bench press, deadlift) live in the Power-to-Strength range; supramaximal isometrics and eccentrics are the only mode that’s strictly Strength. Read horizontally to ask “what loads do I need to express this training mode?” Read vertically to ask “for this zone, what modes are appropriate?”
The ranges are illustrative, not prescriptive. A heavy Olympic lift can drift into Strength with the right athlete; a lifter using Accommodating resistance with very light bands can reach down into Speed. Use them as starting points, then adjust based on bar speed and athlete history.
When to use it
- Programming a session. “Power day” → load 35–80 % 1RM. “Strength day” → 80 %+. “Speed day” → ≤ 35 %. One number, one zone, no translation.
- Phasing a block. A Power → Strength → Power cycle is three load ranges, not five velocity ranges.
- Calling a deload. Drop the working load by ~20 % within the same zone — keep intent, lose fatigue.
Common variations
The 35 % and 80 % boundaries are deliberate round numbers, not exact transitions. Lifters with a strength bias might push their Power zone up to 85–90 % before strength dominates; speed-biased athletes might end Speed at 30 %. Sport context shifts everything: Olympic-lift derivatives push the whole model rightward because their power lives at much higher loads.
The model also doesn’t claim Speed and Strength can’t also train power; they can. The zone names mark the dominant adaptation, not the exclusive one.
Pitfalls
- Treating boundaries as walls. A 78 % working set isn’t categorically different from an 82 %. The bands are about which adaptation dominates, not which is permitted.
- Using on lifts the model wasn’t fit on. The Power-zone width is a squat / bench heuristic. Deadlift power lives further right; Olympic lifts further still.
- Forgetting velocity still matters. The 3-zone model is a load-based summary; you still need bar speed inside each zone to confirm intent and read fatigue.
Where to go next
For the deeper case for collapsing 5 zones into 3, read Velocity zones part 4 and Velocity zones part 2. To see the underlying curves the zones are built on, the Load–power profile and Load–velocity profile are the same data, broken out per quantity.
Download high res chart images
High-resolution PNG, 1600×1000, watermarked. Free to share, embed in slides, or print. Credit appreciated.