Velocity targets — reading today's working weight off your load–velocity profile
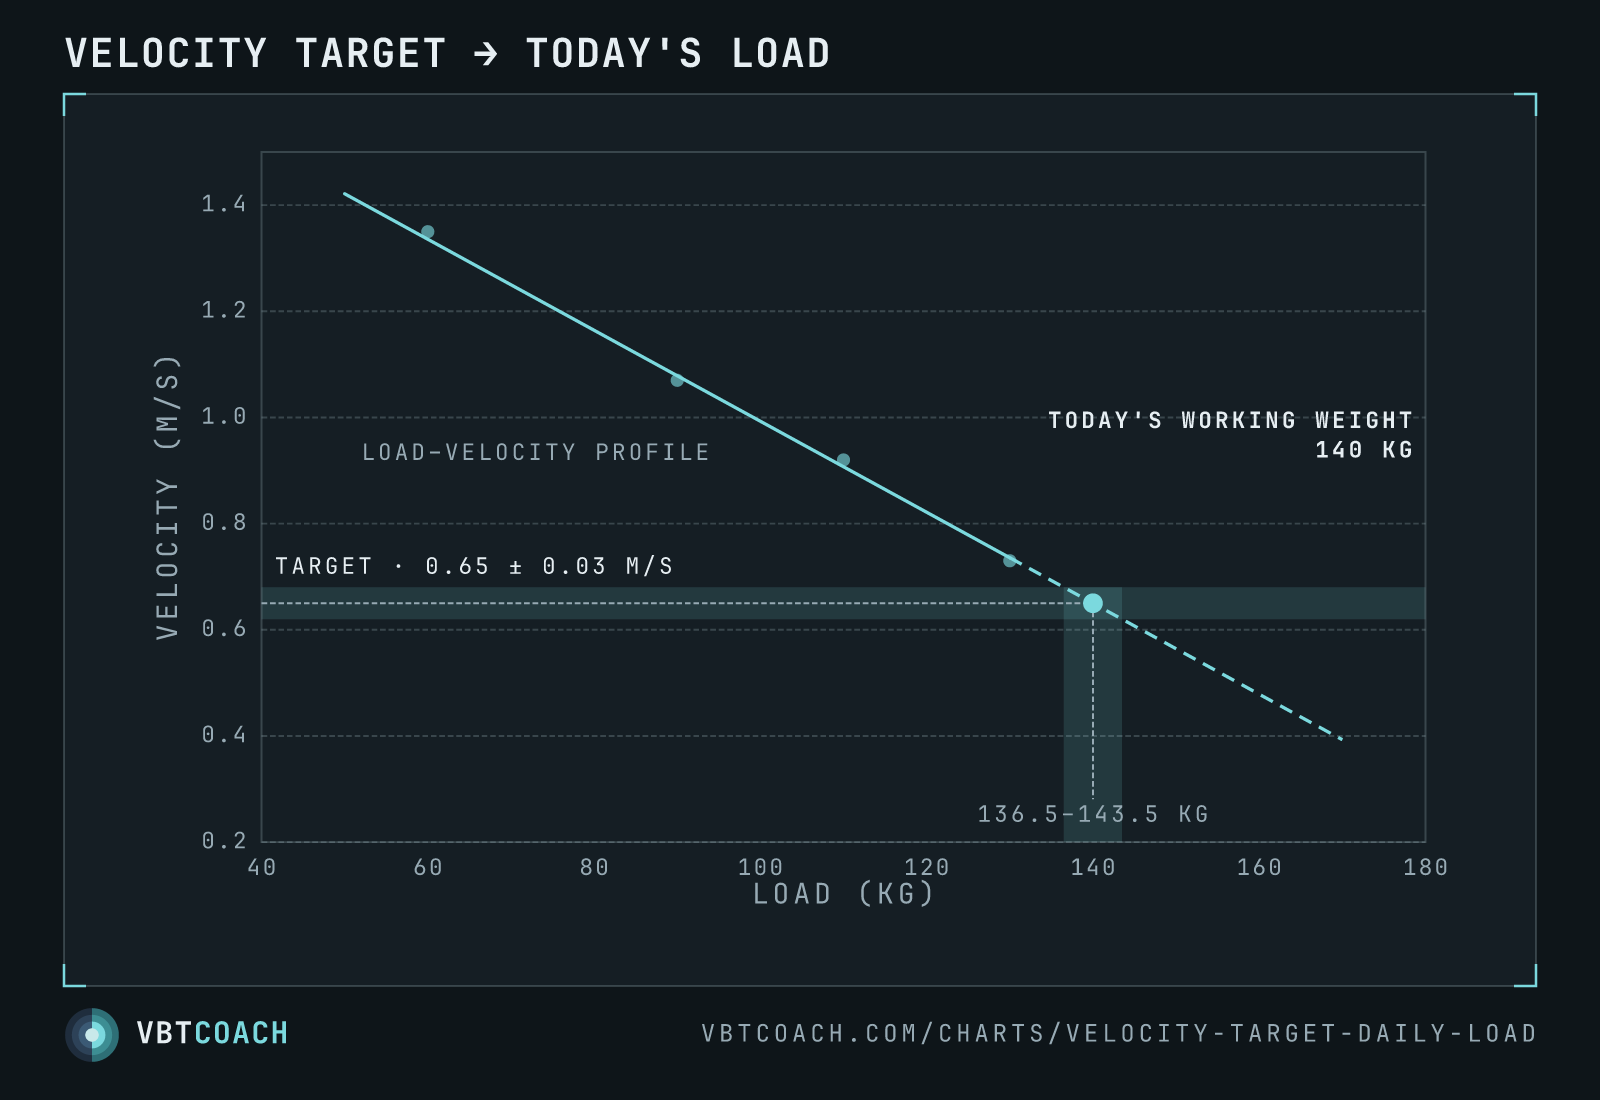
How a velocity target turns into a weight on the bar. Warmup sets build the day's load–velocity profile, a target band is laid across it, and the crossing drops to the load axis as the working weight.
Velocity-target programming writes the plan in bar speeds and leaves the weight open. This chart is the moment the two meet: the point where a number on a program sheet becomes a number on the bar.
How to read this chart
Load runs along the bottom, best-rep velocity up the side. The four dots are warmup sets — every one tracked, none of them prescribed. The line through them is the day’s load–velocity profile.
Then the target does its work, in two steps:
- Across. The horizontal band is the target: 0.65 m/s, with the ±0.03 m/s tolerance drawn either side of it. Follow it right until it meets the profile.
- Down. Drop from the crossing to the load axis. That’s the working weight — 140 kg today.
The vertical band is the same tolerance projected onto the load axis: 136.5–143.5 kg. Anything in that window is a legitimate answer to “0.65 m/s” — including 137.5 kg and 142.5 kg, the loadable weights either side of 140.
Why the target is a band, not a line
Because ±0.03 m/s is worth about ±3.5 kg on this profile — more than the 2.5 kg plate jump either side of 140.
Chase the exact number and you’ll burn warmup singles hunting for a load that doesn’t exist on the rack. Accept the band and the profile hands you a weight you can actually load, on the first attempt, most sessions. The precision you gain from narrowing the target is smaller than the noise in your own bar speed from rep to rep — so it isn’t precision, it’s theatre.
The band also sets the correction rule. First working set comes in above the band, add weight. Below it, either repeat the load with more intent or strip a little off. Inside it, carry on.
The dashed segment matters
The profile is solid across the loads that were actually lifted and dashed past the heaviest warmup. The working weight is read off the dashed part — 140 kg sits beyond the 130 kg warmup.
That’s not a flaw in the method, it’s the method: you are extrapolating a short distance from four fresh data points collected minutes ago. It’s a much shorter reach than “87.5 % of a 1RM I tested in March”. But it is still a reach, which is why a primer single just under the projected weight is worth doing on days you’re unsure. It converts the dashed line back into a solid one before the working sets start.
When to use this
- Every session that runs on a velocity target. This is the whole daily procedure — warm up, plot, cross, drop, lift.
- When readiness is in question. A tired athlete’s profile sits lower, so the same target line crosses it further left and hands back a lighter bar. Nothing needs deciding; the weight has already adjusted.
- When teaching the method. Athletes get it faster from the picture than from the explanation.
Pitfalls
- This target is a best-rep number, not a last-rep number. The target autoregulates intensity — how heavy today’s bar is. Last-rep velocity or velocity loss autoregulates exertion — how many reps you do with it. Run both if you like, but don’t confuse one for the other.
- Four warmup sets, not two. Two points define a line but not a profile; the fit gets unstable fast at the heavy end where you’re reading it.
- Don’t re-plot mid-set. The profile is built from warmups. Fatigue from working sets bends it, and reading the day’s load off a fatigued profile compounds the fatigue.
- The extrapolation has a range limit. Reading 0.65 m/s off a profile built at 60–130 kg is fine. Reading 0.35 m/s off it is a guess dressed up as data.
Where to go next
The underlying tool is on the load–velocity profile chart, and the same crossing trick pointed at the minimum velocity threshold gives you an e1RM instead of a working weight. For the full 18-week structure these daily readings sit inside, see velocity-target block progression. Background on the profile itself is on the load–velocity profiling topic page.
Download high res chart images
High-resolution PNG, 1600×1000, watermarked. Free to share, embed in slides, or print. Credit appreciated.