Cormie 2007 — power training alone versus strength plus power training
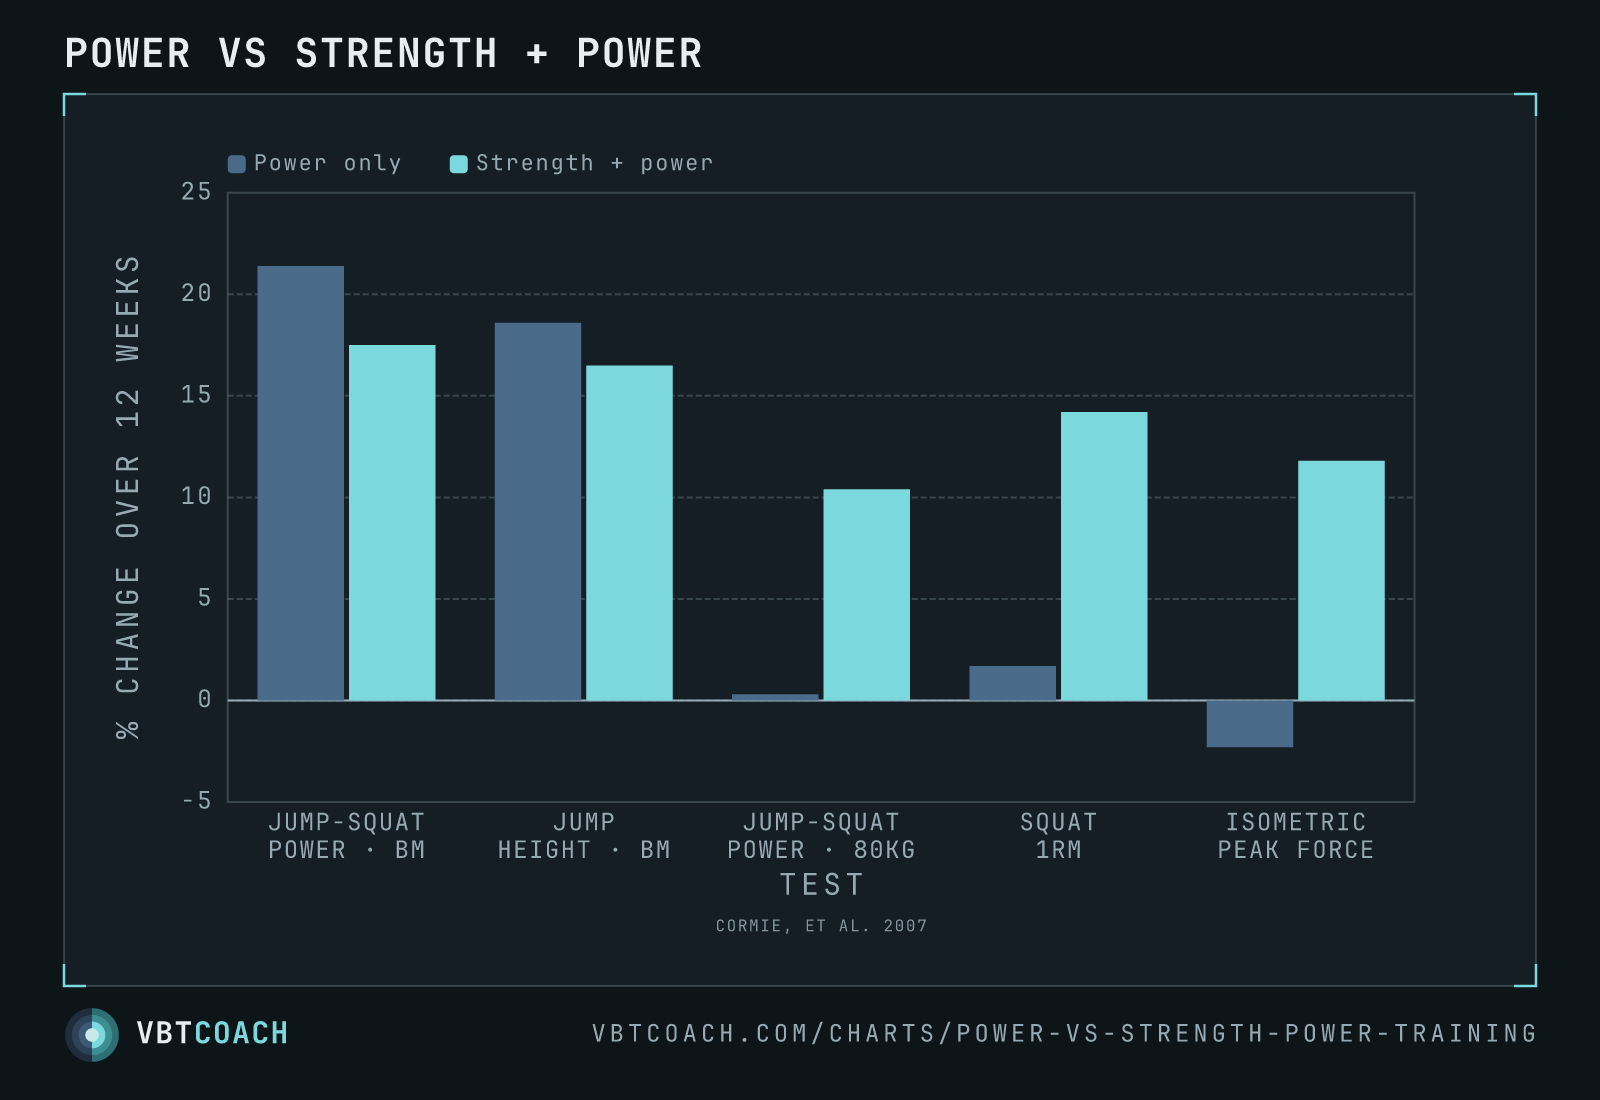
Cormie 2007 — 12 weeks of jump squats, matched for total work. Adding 3×3 back squats at 90 % 1RM produced the same jump and power gains as power-only training, plus everything the power-only group failed to gain.
Twenty-six recreationally trained men, 12 weeks, jump squats at the optimal power load. The only difference between the two training groups was what got added:
- Power only (P). Seven sets of six jump squats at body mass.
- Strength + power (SP). Five sets of six jump squats at body mass, plus three sets of three back squats at 90 % 1RM.
Total work was matched. The combined group traded two sets of jumps for three sets of heavy squats — and the trade was free.
How to read this chart
Five outcomes, percentage change from baseline to the 12-week posttest. Dark bars are power-only; the lighter bars are combined strength + power.
The first two categories are a tie. Peak power at body mass and jump height at body mass both improved by roughly the same amount in both groups. This is the finding people quote when they argue heavy squatting is unnecessary for jumping, and on these two measures they’re right: there was no significant difference between the groups.
The last three aren’t close. Peak power under an 80 kg bar, squat 1RM, and maximal isometric force all moved substantially in the combined group and not at all in the power-only group. Squat 1RM went +14 % vs +2 %; maximal isometric force +12 % vs −2 %. On all three, only the combined group’s change reached statistical significance.
So the combined group got everything the power group got, and kept a pile of adaptations the power group never developed — from a smaller volume of jump training.
The load–power curve is the real story
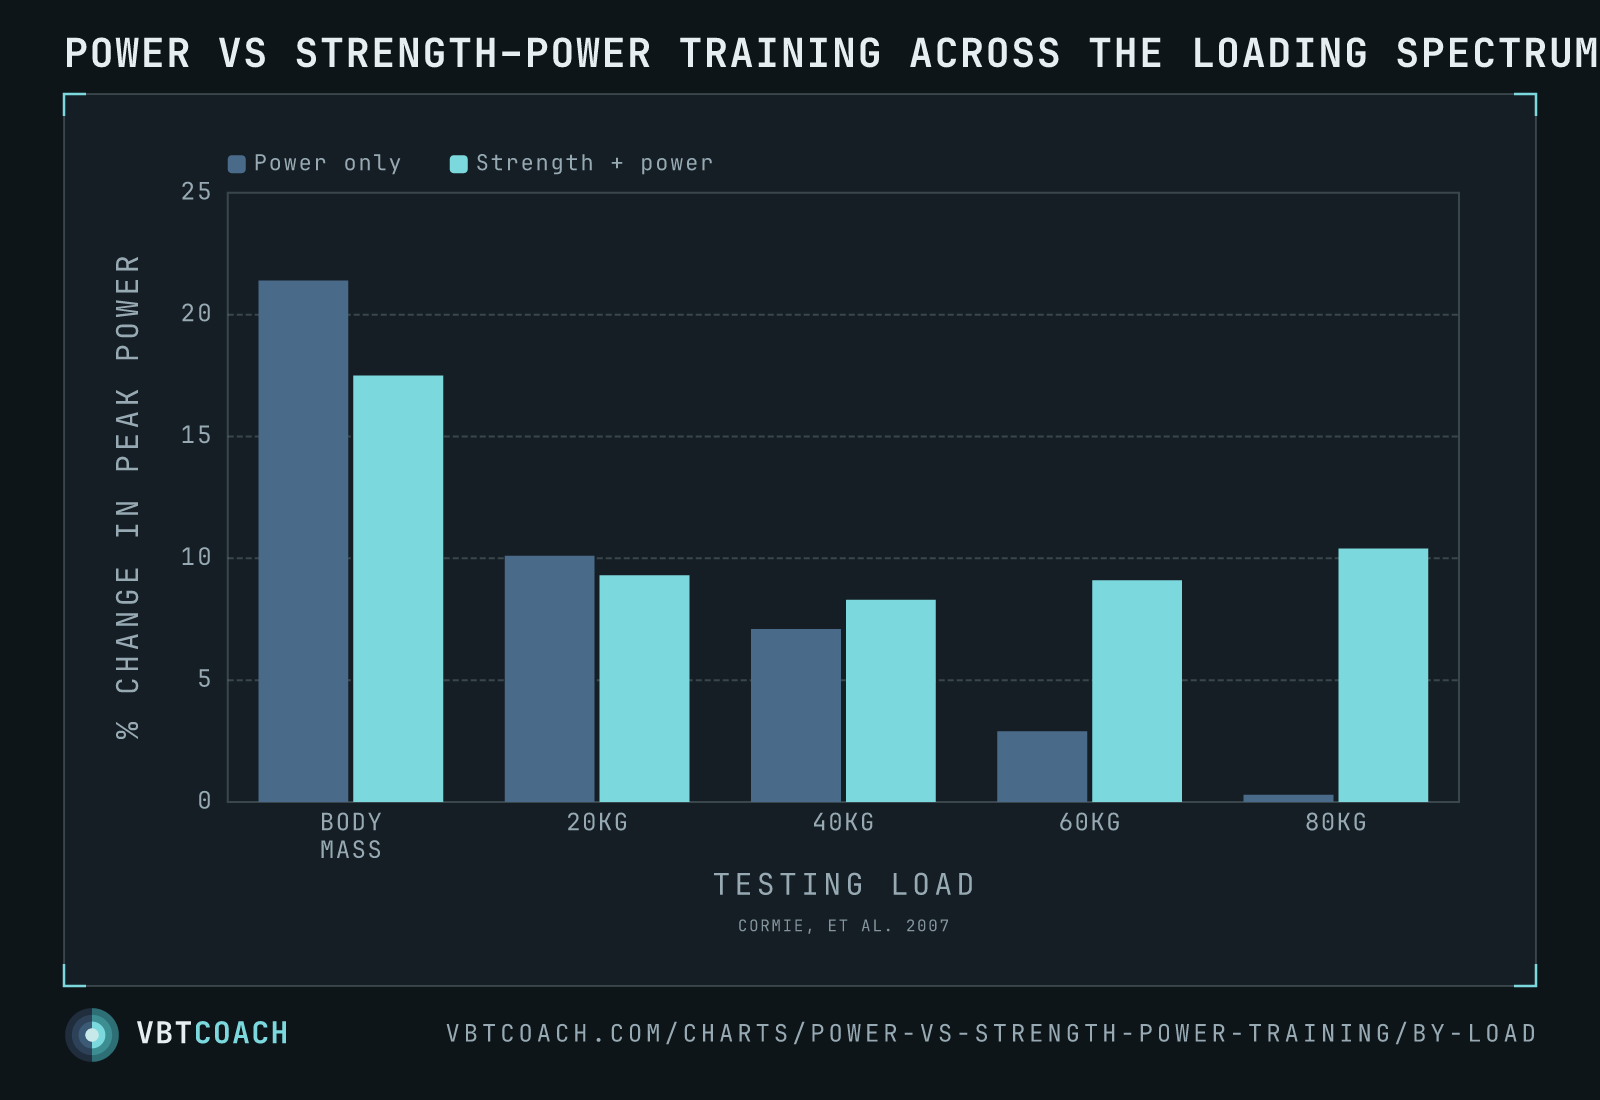
This second view plots peak power change at every testing load.
| Load | Power only | Strength + power |
|---|---|---|
| Body mass | +21 % | +18 % |
| 20 kg | +10 % | +9 % |
| 40 kg | +7 % | +8 % |
| 60 kg | +3 % | +9 % |
| 80 kg | +0 % | +10 % |
The power group’s change was non-significant at 40, 60 and 80 kg. The combined group’s was significant at every load, body mass included.
Power-only training rotated the load–power curve: big gains where they trained, decaying to zero by 80 kg. Combined training shifted the whole curve up, holding 8–10 % across the entire spectrum.
The mechanism is in the paper’s own numbers. Power-only training improved power output without any change to maximal force or maximal dynamic strength (1RM 108 → 109 kg, isometric force 2202 → 2152 N). Combined training raised both (1RM 119 → 136 kg, isometric force 2256 → 2521 N), and raising the force end of the curve lifts power at every load that requires force.
What this means for programming
- Don’t drop heavy strength work to “train power.” It cost this group nothing in jump height or unloaded power, and bought them everything above 40 kg. Chapter and verse for why a power block still carries a heavy squat.
- The specificity is in the load, not the intent. Both groups jumped with maximal intent. Only the group that also produced high force under a heavy bar improved at producing high force under a heavy bar.
- Athletes who express power against external resistance need the strength half. A jumper is closest to the body-mass condition. A wrestler, rower, prop or lineman lives at the 60–80 kg end of this chart, where power-only training did nothing.
- Volume is not the lever you think it is. SP did 29 % fewer jump-squat sets and matched P on every jump-squat outcome.
Pitfalls
- Small, and untrained-ish. N = 10 (P) and 8 (SP), squat 1RM:body mass 1.4–1.5. Trained lifters would likely respond less to both interventions, and the paper says as much.
- Twelve weeks. Long enough to shift strength, short enough that most of the power-only group’s gains are plausibly neural.
- Percentages of different bases. These are within-group changes from each group’s own baseline, and baselines differed slightly at the heavy loads. The direction and size of the split survives that; individual decimal points don’t.
- Peak power and jump-height values are digitised from the paper’s figures (it publishes those as plots, not tables), so read them as ±0.5 percentage points. Squat 1RM and isometric force come straight from Table 4.
- This is not an argument for maximal strength work alone. Both groups jumped. The comparison is power versus power plus strength, not power versus strength.
Where to go next
For where these loads sit conceptually, see the VBTcoach 3-zone model and the force–velocity curve. The load at which power peaks for a given lift is on the load–power profile, and the wider framing is on the power topic page.
Download high res chart images
Every chart on this page as a high-resolution PNG — 2 exports, 1600×1000, watermarked. Free to share, embed in slides, or print. Credit appreciated.