The 16-week power cycle — the three loads it anchors to on your power curve
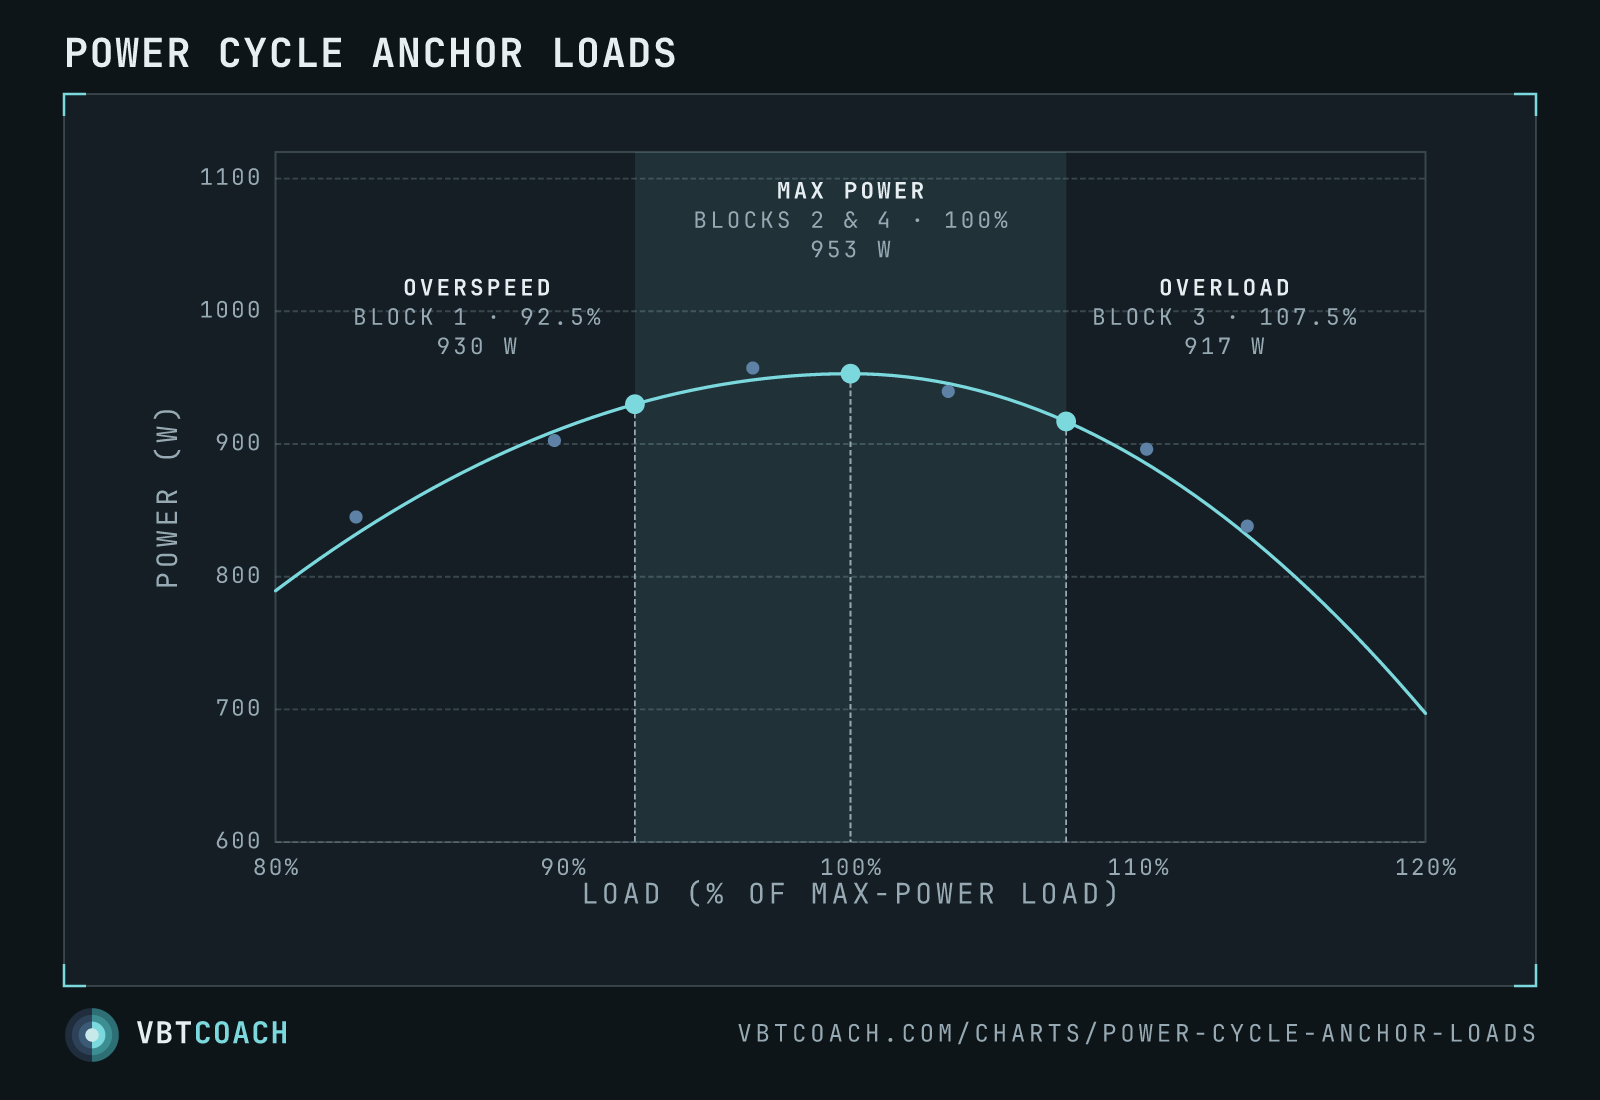
A load–power curve marked with the three loads a 16-week power cycle works across — 92.5 % for overspeed, 100 % for max power, 107.5 % for overload — read as percentages of the load that produces peak watts.
Velocity targets anchor strength work to a bar speed. Power training anchors to wattage — and specifically to the load that produces the most of it. This chart is the curve that load sits on, with the three points a 16-week cycle deliberately works across.
How to read this chart
Load runs along the bottom as a percentage of your max-power load, not in kilos, so the chart applies to any athlete and any lift. Watts up the side. The dots are testing-week sets; the curve is the profile they produce.
Three anchors are marked:
- 92.5 % — overspeed (block 1). Lighter than optimal. The bar moves faster than it does at the apex, and power is a couple of percent below peak.
- 100 % — max power (blocks 2 and 4). The apex itself.
- 107.5 % — overload (block 3). Heavier than optimal. More force, less speed, and again a few percent below peak.
The tinted band is the whole programme. Sixteen weeks of training happens inside a 15 % window.
The flatness is the point
The single most useful thing on this chart is how little power you give up by moving off the apex. On this profile, ±7.5 % of load costs 2–4 % of peak watts. The curve near its top is nearly flat.
That’s what licenses the programme. You can spend four weeks either side of the optimal load without training “the wrong quality” — you are still within a few percent of maximum power output the whole time, while changing which end of the force–velocity relationship is doing the work. Overspeed leans on velocity, overload leans on force, and the two blocks in the middle express the result.
Note the curve is not symmetric. Power falls away faster above the optimal load than below it, because velocity collapses faster than force accumulates. The overload block is therefore the more expensive of the two excursions in watts, and it is the one you keep shortest.
The cycle
Testing and profiling week first: sets of 2–3 reps at small increments across your working range, two or more minutes rest. For an athlete whose hang power cleans live at 75–80 kg, that’s 40, 60, 65, 70, 75, 80 and 82.5 kg. It’s a good power session in its own right, and it’s the only way to get a profile with enough resolution to pick an apex from.
- Block 1, weeks 1–4. 3×4 at 92.5 %
- Block 2, weeks 5–8. 4×2 at 100 %
- Block 3, weeks 9–12. 4 rounds of 2×1 clusters at 107.5 %, 30 s inside a round, 2–3 min between
- Block 4, weeks 13–16. 4 rounds of 2×2 at 100 %, same rest structure
The PR is meant to land in block four, when you come back to the apex with a force end and a velocity end that have both moved.
The worked example
An 80 kg athlete, hang power clean. Testing week puts max power at 72.5 kg with 953 W.
- Block 1 runs at 67.5 kg — fast, consistent fours in the low 800s. Below the curve, because these are sets of four, not the fresh doubles the profile was built from.
- Block 2 moves to 72.5 kg doubles. By the back half of the block the profile itself has shifted: max power now sits at 75 kg, and the athlete posts 988 W (+3.7 %) in week 8.
- Block 3 loads 80 kg singles for low-900s watts. Below a PR, and that’s expected — it’s the far side of the apex.
- Block 4 returns to 100 %, which is now 76 kg. Two weeks at 75 kg for 980+ W, then two at 77.5 kg for 1000 W — a PR by more than 80 W (+8.4 %).
The curve didn’t just rise, it widened. More watts at every load, which is the outcome the three-anchor structure is built to produce.
Pitfalls
- Block watts don’t sit on this curve, and shouldn’t. The profile is built from fresh doubles and triples. A set of four at the same load will read lower. Compare block output to the same block’s previous week, not to the profile.
- Re-profile if the curve moves. If your working weights climb mid-block, recalculate the apex from that session’s own numbers rather than the testing week’s.
- Round to real plates. 107.5 % of 72.5 kg is 78 kg; the example loads 80 kg. Anywhere inside a couple of percent is the same point on this curve.
- Percentages of the max-power load, not of 1RM. They’re different numbers and the whole programme falls apart if you mix them up.
- The apex is exercise-specific. A hang power clean, a jump squat and a trapbar jump all peak at different loads. Profile each one you intend to programme this way.
Where to go next
Finding the apex in the first place is on the maximum-power profile, and the underlying shape is on the load–power profile. For the strength-side equivalent of this programming method, see velocity target → today’s load and its 18-week block structure. Wider framing on the power topic page.
Download high res chart images
High-resolution PNG, 1600×1000, watermarked. Free to share, embed in slides, or print. Credit appreciated.