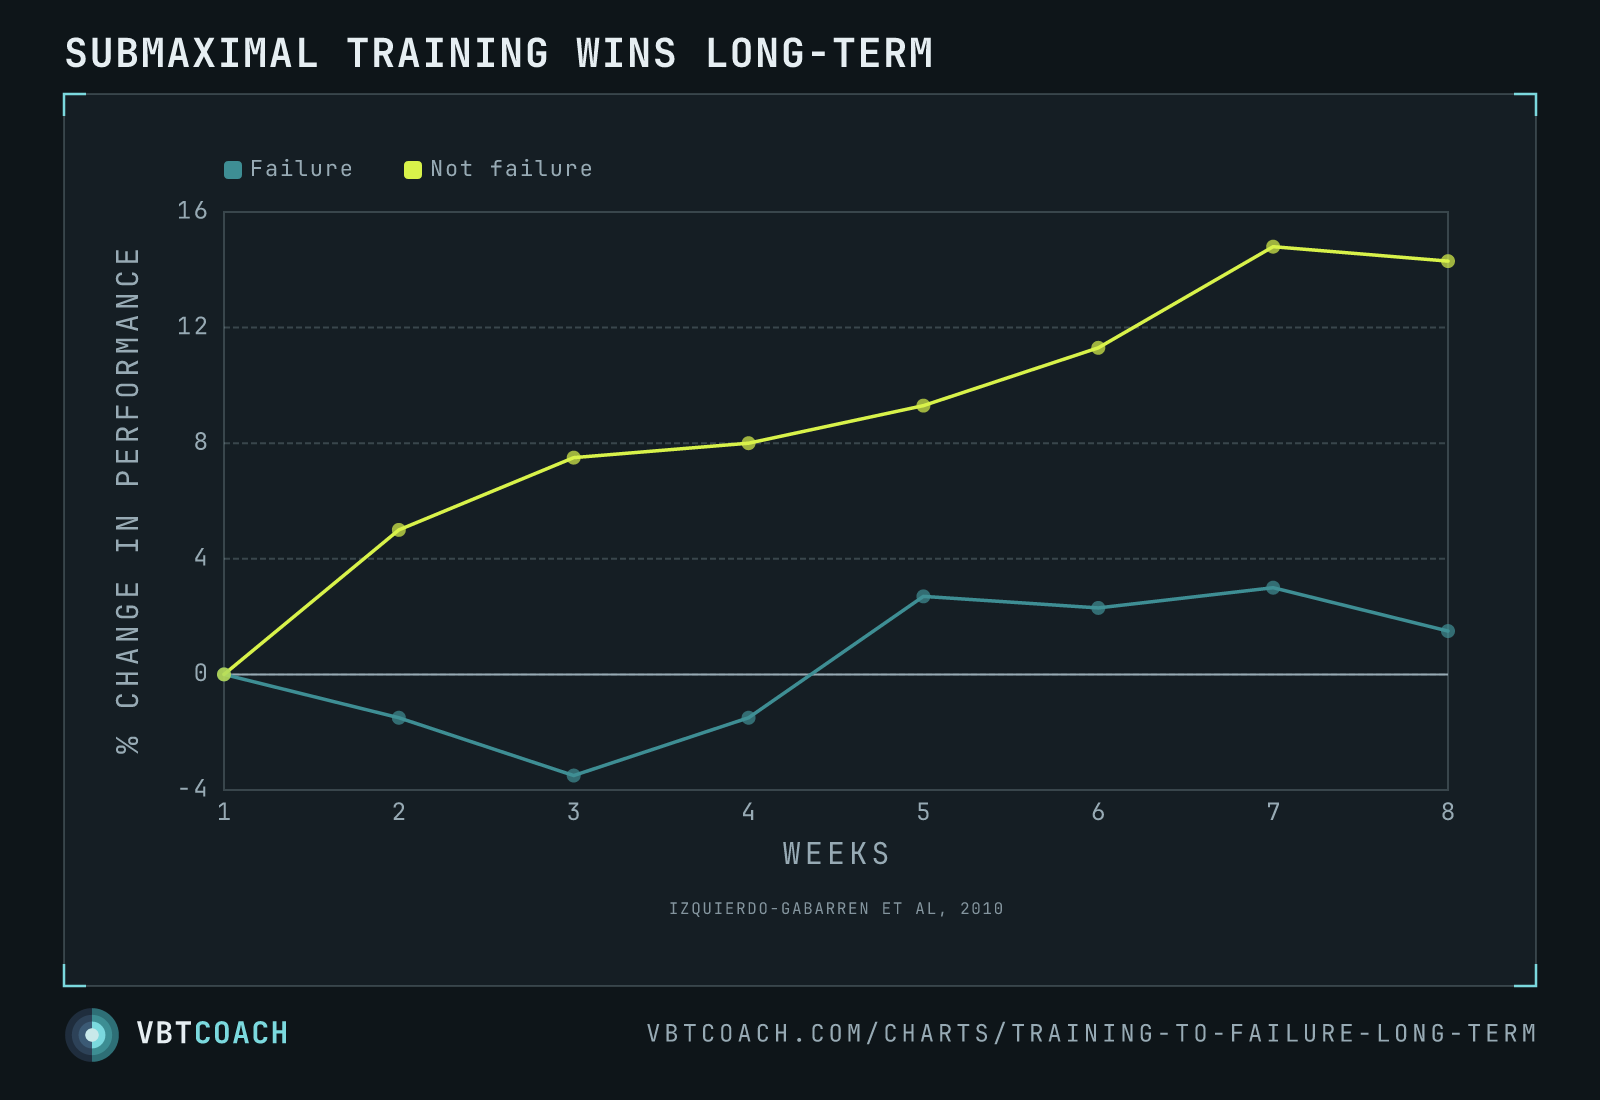
Izquierdo-Gabarren 2010 — not-to-failure out-gains failure across 8 weeks
Izquierdo-Gabarren 2010 — across 8 weeks, stopping sets short of failure (20% velocity loss) produced steady gains while training to failure (40% velocity loss) lost performance early and never caught up.
Izquierdo-Gabarren and colleagues tracked two volume-matched groups across 8 weeks. Both trained the same exercises and the same loads. The only difference was how aggressively sets were taken: one group trained to failure (a 40 % velocity-loss cap), the other stopped every set short of it (20 % velocity loss). The trajectory of gains tells the story far better than a single end-point comparison would. The failure group spent the first weeks below baseline; the not-to-failure group climbed steadily from week 2.
How to read this chart
Two lines, one per group, plotted across the 8 weeks of training. The teal line is the failure group (sets driven to a 40 % velocity loss); the signal-lime line is the not failure group (sets stopped at 20 % velocity loss). Y-axis is percent change in performance from baseline.
The not-failure line climbs almost linearly from week 2 to week 7 (peak at +14.8 %) and holds. The failure line dips below baseline through weeks 2–4 (-1.5 %, -3.5 %, -1.5 %), turns positive in week 5, and never catches up — finishing week 8 at a modest +1.5 %.
The cumulative effect is striking. By week 8, the not-failure group has gained roughly 10× more performance than the failure group with the same total volume and the same load progression.
When to use this evidence
- Defending sub-failure programming to powerlifters and bodybuilders. “Training hard” doesn’t mean training to failure. The not-failure group worked just as hard in the gym; they just stopped sets earlier each time.
- Explaining mid-block stagnation. A lifter stuck in weeks 3-4 of a high-effort block who isn’t progressing isn’t broken — they’re carrying accumulated fatigue from taking sets too close to failure.
- Justifying velocity-loss caps. A velocity-loss cap is the practical instrument for keeping sets off failure — this study set its two arms with exactly that. The Pareja-Blanco family of papers replicates the same direction with different metrics.
Why training to failure backfires
The last reps of a set driven to a 40 % velocity loss are mostly junk volume — extreme central-nervous-system cost for negligible adaptation benefit. Across a multi-week block, that fatigue compounds. The lifter’s recovery never catches up, working capacity drops, and the next block starts from a deeper hole than the previous. Stopping short ends sets while every rep is still high-quality, leaving a stimulus the body can actually adapt to.
Pitfalls
- The hypertrophy story is more nuanced. This chart focuses on strength and power outcomes. For pure muscle growth (where fatigue management isn’t the constraint), deeper v-loss has more support — though even there the signal is mixed.
- Volume-matched ≠ effort-matched. “Failure” and “not failure” can be parameterised many ways: RIR-based, v-loss-based, rep-count-based. They all behave slightly differently. This study used velocity-loss caps as the parameter — 40 % for the failure arm, 20 % for the not-failure arm.
- Trained-population matters. The literature on novices is murkier — beginners often respond to almost anything, including failure training.
Where to go next
For the case in prose form, the risk and reward of training to failure covers the mechanism and the trade-offs. The short-term complement to this chart shows what happens within a session — failure-induced performance loss measured at 0, 6, and 48 hours post-workout. For the velocity-loss reframe, see velocity-loss multi-metric.
Download high res chart images
High-resolution PNG, 1600×1000, watermarked. Free to share, embed in slides, or print. Credit appreciated.