Behm & Sale 1993 — Intended velocity, not actual velocity, drives the training response
Behm & Sale 1993 — a limb strapped down so it couldn't move, training with the intent to move fast, gained just as much high-speed strength as the limb that actually moved fast.
This is the study the whole “train with intent” argument rests on, and the design is why it carries so much weight.
Sixteen subjects trained ankle dorsiflexion three days a week for 16 weeks. Every subject trained both legs, with the same instruction each time: contract as hard and as fast as you possibly can. One leg was strapped down so nothing moved — a maximal ballistic attempt against an immovable restraint. The other leg was free to fly through the range at 5.23 rad/s on an isokinetic dynamometer.
Same intent. Opposite mechanics. The limb that never moved gained just as much high-speed strength as the limb that did.
How to read this chart
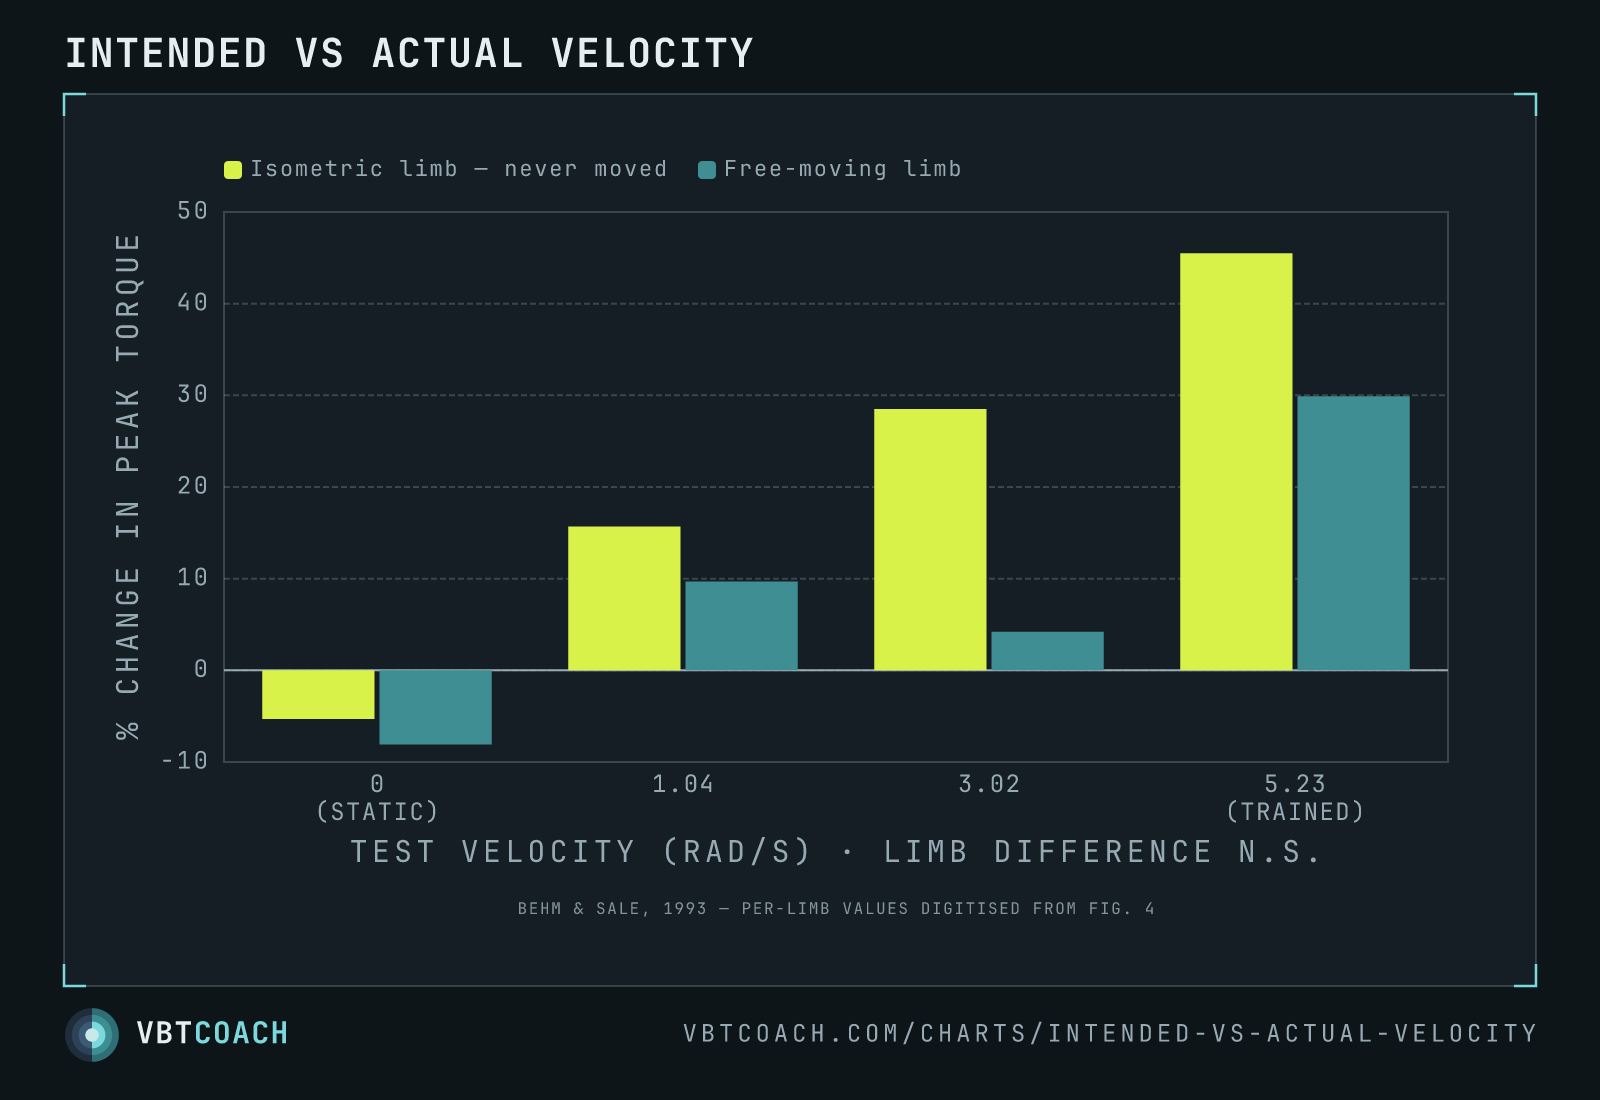
Four test speeds across the bottom, from a static contraction (0 rad/s) up to the training velocity of 5.23 rad/s. Lime bars are the isometric limb — the one that spent 16 weeks straining against a strap without moving a millimetre. Teal bars are the free-moving limb. Both are percentage change in peak torque after training.
Two things to take from it:
- The isometric limb kept pace at every speed. It wasn’t a watered-down version of the real thing. It was the real thing, minus the movement.
- Both limbs show the same velocity specificity. The gains only show up when you test fast. Test either limb statically and the training looks like it did nothing at all.
If intent were merely a nice-to-have and actual movement velocity were the driver, the teal bars would tower over the lime ones. They don’t.
Why the percentages look enormous
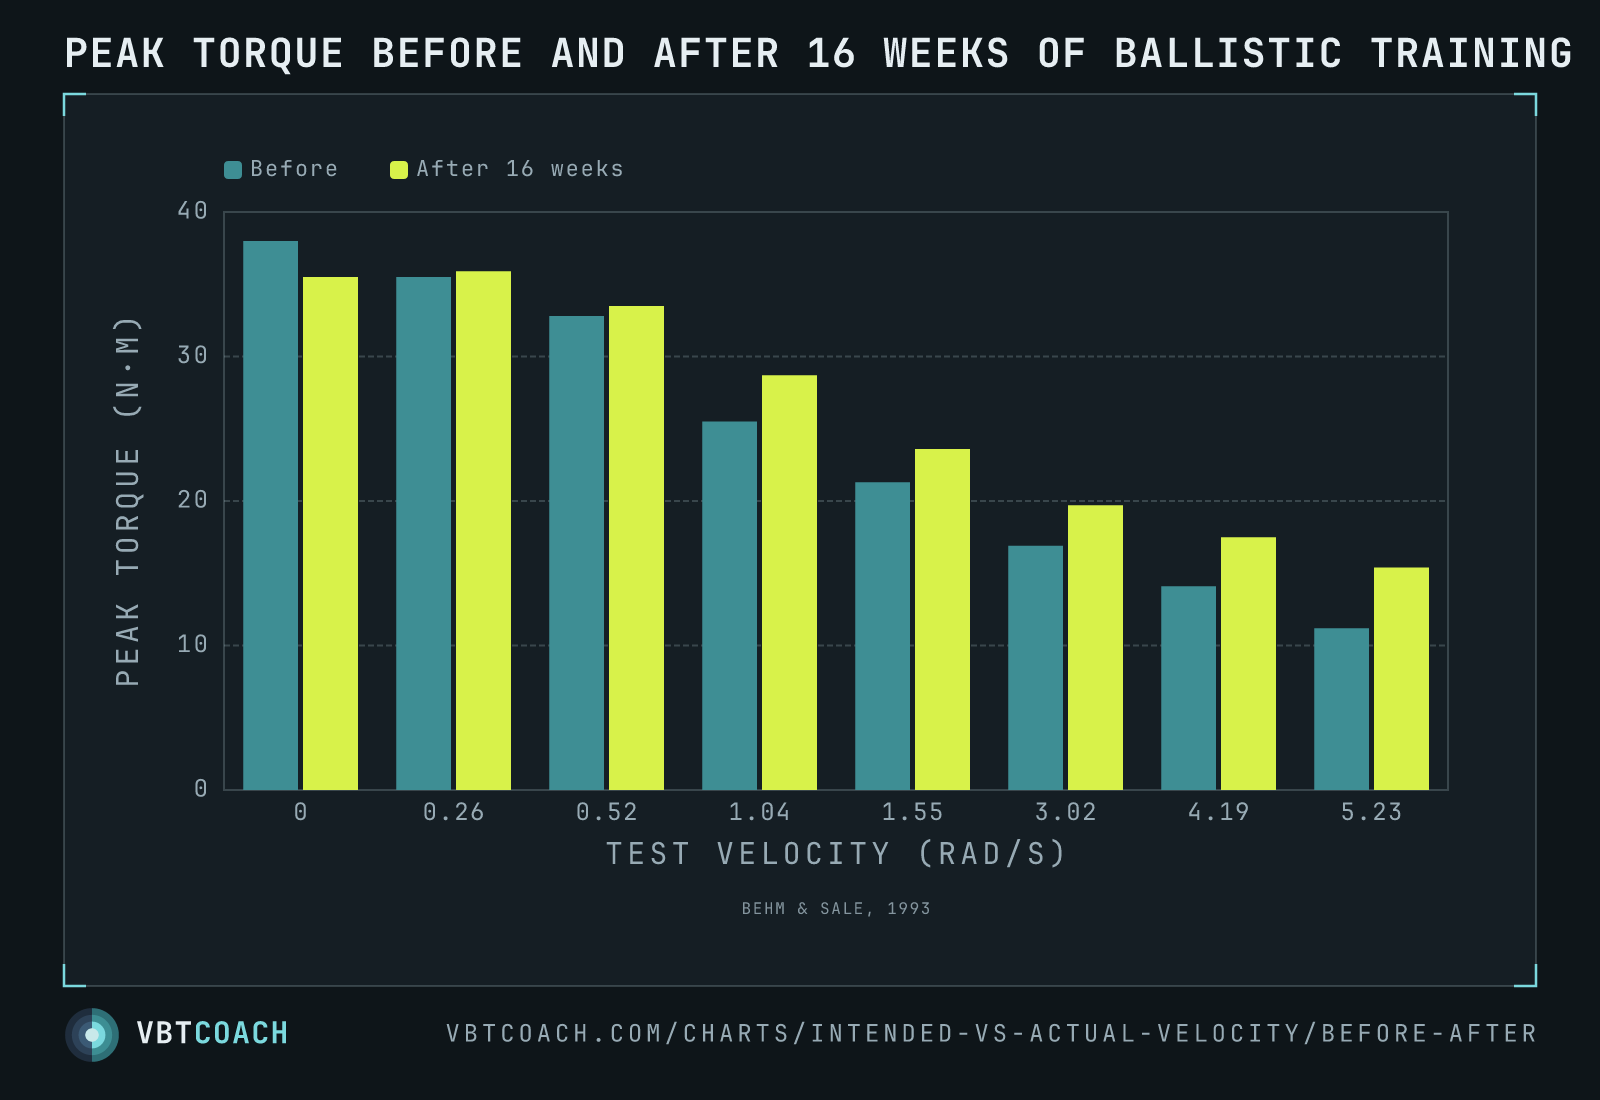
They’re big percentages of small numbers. At the training velocity, peak torque went from 11.2 to 15.4 N·m — about four newton-metres, in a muscle that dorsiflexes an ankle, in untrained people, over 16 weeks. Trivial in absolute terms; +37.7 % on the scoreboard. High-velocity torque starts near the floor, so it has room to move in percentage terms that a squat 1RM never does. Don’t transplant these effect sizes onto a barbell.
An honest caveat about those bars
The isometric limb looks like it gained more, especially at 3.02 rad/s. Don’t sell that. The study found no significant mode × time interaction, which is precisely why the paper pools the two limbs for its published numbers and never runs a limb-vs-limb post-hoc test. The authors go only as far as saying the isometric leg’s response “may have been greater.”
Because no per-limb percentages are published, the per-limb bars here are digitised from the paper’s Fig. 4, with each pair anchored so the two limbs average to the pooled change the paper does publish. Pooling those digitised reads reproduces the published numbers to within ~1.5 points at every speed, which is what gives me confidence in the totals — but how each total splits between the two limbs is read off a 1993 scan with no error bars, so treat the size of the gap as soft. A paired design with 14 subjects would probably have caught a gap that large, and the ANOVA didn’t.
The claim this chart supports is “at least as good,” not “better.”
The same data, two other ways
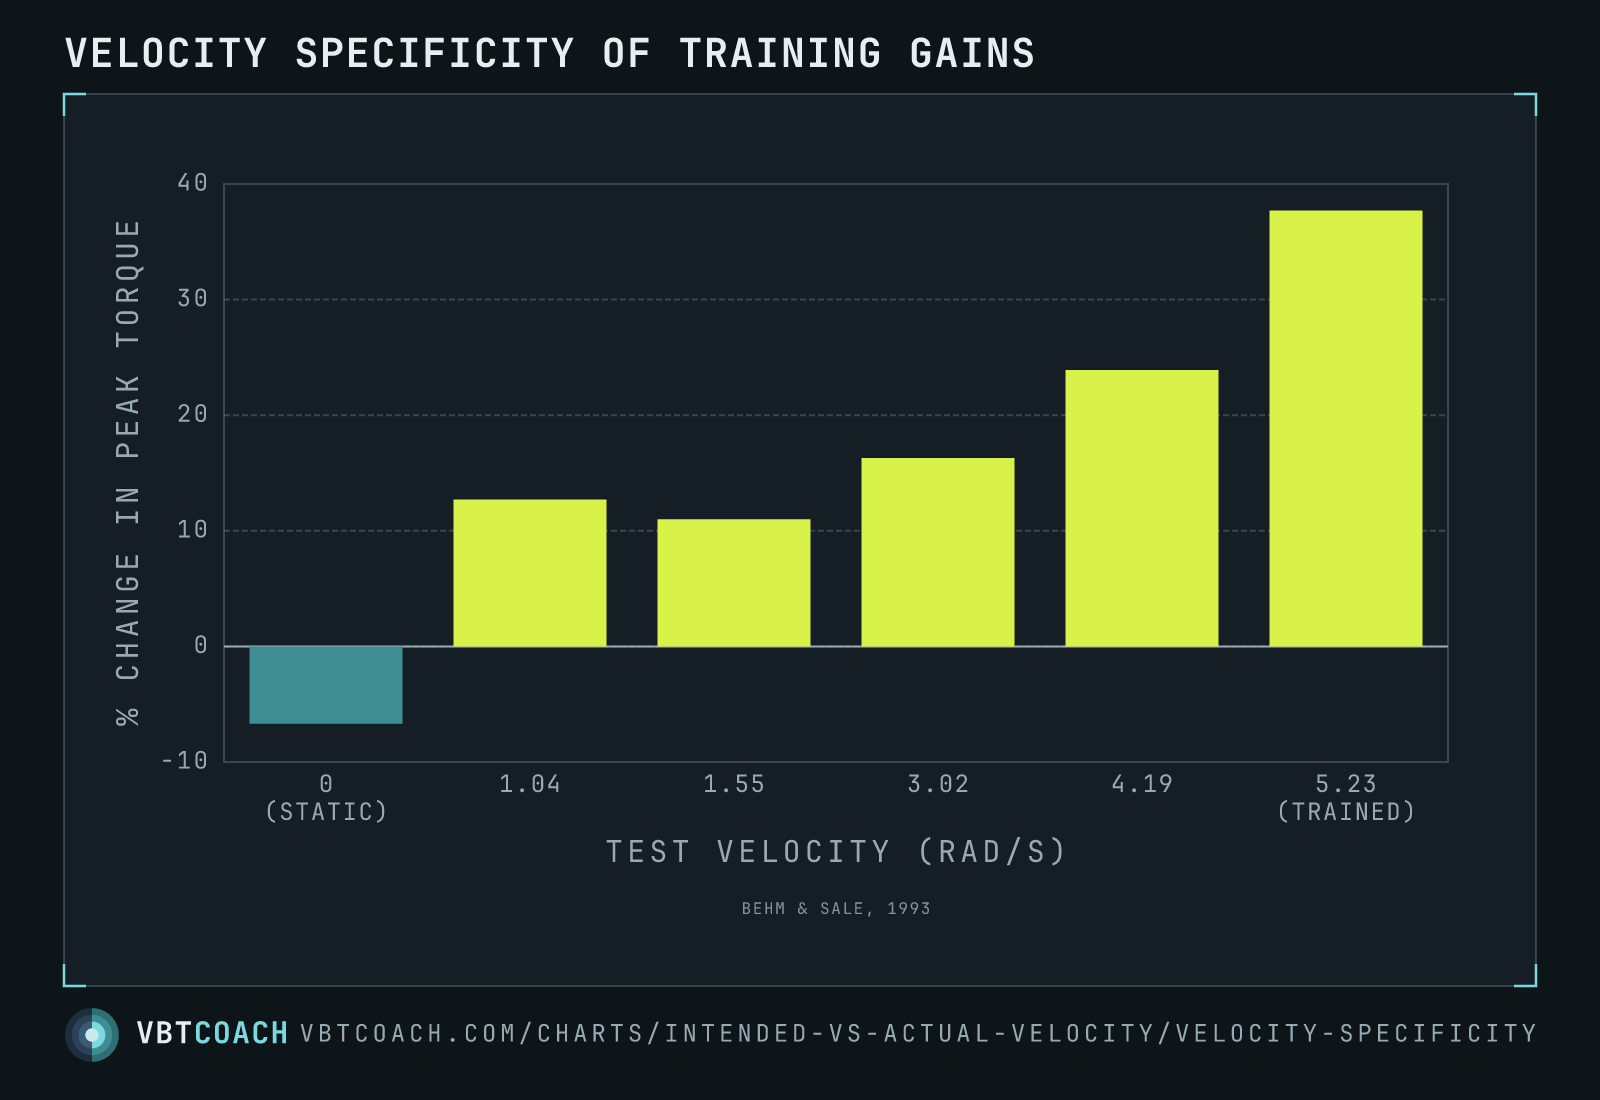
Pooled across both limbs, this is the velocity-specificity result on its own: +37.7 % when tested at the training velocity, +16.3 % at 3.02 rad/s, and below baseline on the static test. Note the x-axis is test velocity — there was no slow-training group, so this is not “fast training beats slow training.” It’s one training programme, measured at eight different speeds.
And in absolute terms: a torque–velocity curve where only the right-hand end moved. If you’ve watched a load–velocity profile rotate rather than shift after a block of explosive work, this is the lab version of the same thing.
When to use this evidence
- Justifying intent as a training variable. Bar speed is the outcome; intent is the input. Strip the movement out entirely and the adaptation still arrives.
- Programming heavy work you can’t move fast. A near-maximal squat crawls no matter what you do. This is why that rep still trains rate of force development — provided you are genuinely trying to accelerate it.
- Rehab and isometrics. A limb that can’t be loaded through range isn’t a lost cause. Maximal-intent isometrics are not a consolation prize.
The catch coaches skip
“Intended velocity is what matters” gets quoted as if actual bar speed is irrelevant. That is not what the data say. The isometric limb still performed attempted ballistic contractions — maximal effort, maximal rate of force development, roughly half-second bursts. It was a high-RFD stimulus without displacement, not a slow grind.
Grinding out a five-second rep while telling yourself you meant it to be fast is not the same thing. The stimulus is the explosive attempt, not the internal monologue.
Pitfalls
- The static test going backwards is not what it looks like. That −6.7 % is a static contraction on the dynamometer. Voluntary isometric peak torque, measured on the study’s separate isometric apparatus, actually rose 9.6 %. Ballistic training didn’t make anyone weaker isometrically — don’t quote the negative bar as though it did.
- Single joint, small muscle, untrained subjects. The mechanism transfers; the effect sizes almost certainly don’t.
- This doesn’t mean cueing intent always helps. Hold actual velocity fixed and change only the words you say, and the benefit disappears — see the intent cueing chart (Rheese 2021).
Where to go next
The counterweight to this chart is Rheese 2021, which cued intent while holding actual velocity constant and found no advantage at all. Read them together — the honest position sits between the two. The topic page on Intent frames the principle, and Fast reps vs slow reps covers what it means for how you actually lift.
Download high res chart images
Every chart on this page as a high-resolution PNG — 3 exports, 1600×1000, watermarked. Free to share, embed in slides, or print. Credit appreciated.